某项目组在应用进行压力测试的过程中,发现高压下的处理响应时间偏低,在50个在线线程的压力下,平均响应时间为两秒,个别最长的响应时间甚至高达20秒。为了更好的分析,取某个时间段为半个小时再次进行压力测试,并发数量为100,准备用loadRunner工具持续性完成30分钟的压力测试,取某两个时间点生成AWR报表,进行分析查找问题所在。
生成AWR报表的方法,依赖awrrpt.sql脚本。登录sqlplus,由于生成的HTML过长,故建立目录保存AWR报表。用SPOOL亦可。
mkdir myawr
cd myawr
sqlplus / as sysdba
SQL>@?/rdbms/admin/awrrpt.sql
Current Instance
~~~~~~~~~~~~~~~~
DB Id DB Name Inst Num Instance
----------- ------------ -------- ------------
1264638695 ORCL 1 orcl
Specify the Report Type
~~~~~~~~~~~~~~~~~~~~~~~
Would you like an HTML report, or a plain text report?
Enter 'html' for an HTML report, or 'text' for plain text
Defaults to 'html'
输入 report_type 的值:
Type Specified: html
Instances in this Workload Repository schema
~~~~~~~~~~~~~~~~~~~~~~~~~~~~~~~~~~~~~~~~~~~~
DB Id Inst Num DB Name Instance Host
------------ -------- ------------ ------------ ------------
* 1264638695 1 ORCL orcl PC-201012040
930
Using 1264638695 for database Id
Using 1 for instance number
Specify the number of days of snapshots to choose from
~~~~~~~~~~~~~~~~~~~~~~~~~~~~~~~~~~~~~~~~~~~~~~~~~~~~~~
Entering the number of days (n) will result in the most recent
(n) days of snapshots being listed. Pressing <return> without
specifying a number lists all completed snapshots.
输入 num_days 的值:1(注:直接回车默认显示AWR采样全部天数的快照点,如果输入1表示只显示当天)
Listing the last day's Completed Snapshots
Snap
Instance DB Name Snap Id Snap Started Level
------------ ------------ --------- ------------------ -----
orcl ORCL 253 01 12月 2011 10:22 1
254 01 12月 2011 11:00 1
255 01 12月 2011 12:00 1
256 01 12月 2011 13:00 1
257 01 12月 2011 14:00 1
258 01 12月 2011 15:00 1
259 01 12月 2011 16:00 1
260 01 12月 2011 17:00 1
Specify the Begin and End Snapshot Ids
~~~~~~~~~~~~~~~~~~~~~~~~~~~~~~~~~~~~~~
输入 begin_snap 的值: 253
Begin Snapshot Id specified: 253
输入 end_snap 的值: 260
End Snapshot Id specified: 260
Specify the Report Name
~~~~~~~~~~~~~~~~~~~~~~~
The default report file name is awrrpt_1_253_260.html. To use this name
press <return> to continue, otherwise enter an alternative.
输入 report_name 的值:(注:回车自动生成awrrpt_1_253_260.html为名称的报表)
Report written to awrrpt_1_253_260.html
查询问题点:
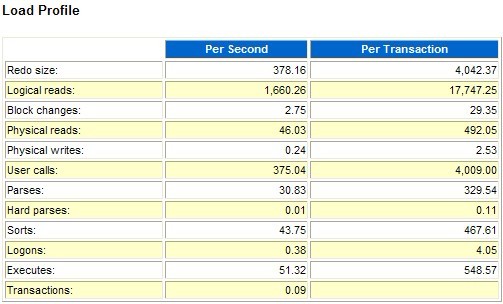
1.查看负载情况:load profile,查看Transactions的每秒的数量。
2.分析排名靠前的等待事件:分析报表等待事件的Top5排名是AWR报表最需关注的地方。
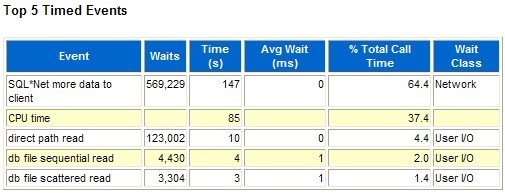
从以上图中可以看出user I/O是最显著的问题,一般也有日志等待也比较突出。
a.CPU的运行时间排名第一,说明当前数据库运行还是比较高效的。
b.如果有日志相关等待,说明要将REDO放置写的快的磁盘和增加日志缓存 两个方案。
c.enq:SQ-CONTENTION说明和序列相关的等待时间,需要对序列增加cache。
d.db file sequential red。
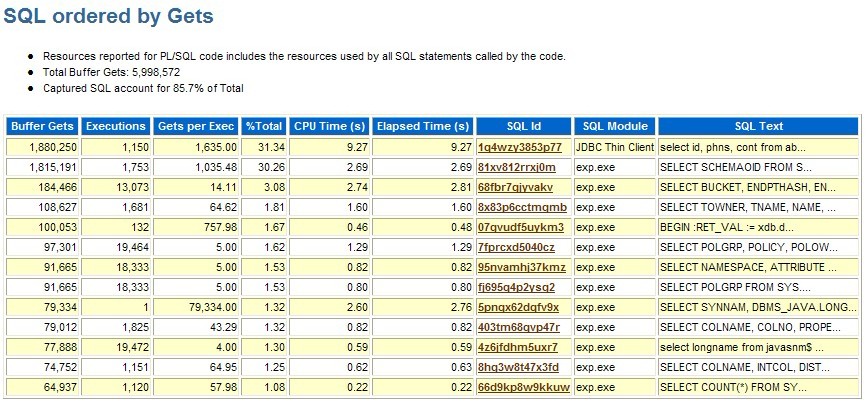
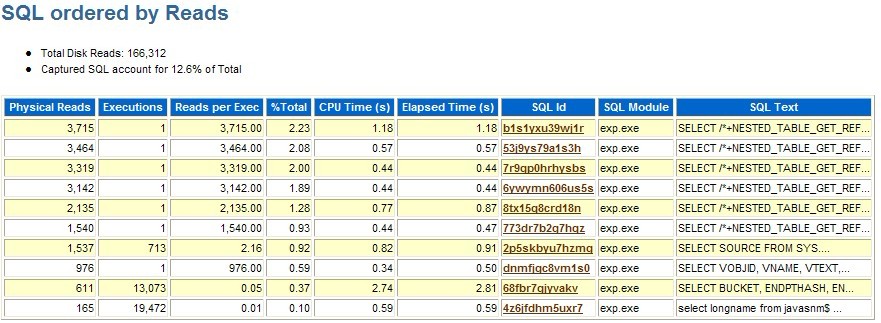
3.开销最大的SQL