����Dzο��ģ�https://blog.csdn.net/soldierofyou/article/details/82661263
��λ����������лл�ˣ�������СС�ĵ���
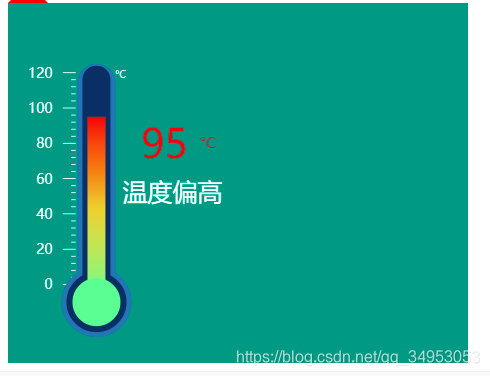
<!DOCTYPE html><html lang="en"><head><meta charset="UTF-8"><title>�¶ȼ�</title><script src="https://cdn.bootcss.com/echarts/4.2.1-rc1/echarts.min.js"></script></head><body><!-- ΪECharts��һ���߱���С�����ߣ���Dom --><div id="main11" style="width: 460px;height:360px;"></div></body><script type="text/javascript">// �������õ�dom����ʼ��echartsʵ��var myChart = echarts.init(document.getElementById('main11'));var TP_value = 95;var kd = [];var Gradient = [];var leftColor = '';var showValue = '';var boxPosition = [65, 0];var TP_txt = ''// �̶�ʹ����״ͼģ�⣬������1����������3������һ������for(var i = 0, len = 135; i <= len; i++) {
if(i < 10 || i > 130) {
kd.push('')} else {
if((i - 10) % 20 === 0) {
kd.push('-3');} else if((i - 10) % 4 === 0) {
kd.push('-1');} else {
kd.push('');}}}//�м��ߵĽ���ɫ���ı�����if(TP_value > 80) {
TP_txt = '�¶�ƫ��';Gradient.push({
offset: 0,color: '#93FE94'}, {
offset: 0.5,color: '#E4D225'}, {
offset: 1,color: '#E01F28'})} else if(TP_value > 10) {
TP_txt = '�¶�����';Gradient.push({
offset: 0,color: '#93FE94'}, {
offset: 1,color: '#E4D225'})} else {
TP_txt = '�¶�ƫ��';Gradient.push({
offset: 1,color: '#93FE94'})}/* if(TP_value > 62) {showValue = 62} else {if(TP_value < -60) {showValue = -60} else {showValue = TP_value}}if(TP_value < -10) {boxPosition = [65, -120];} */leftColor = Gradient[Gradient.length - 1].color;// ��Ϊ��״��ʼ��Ϊ0���¶ȴ��ڸ�ֵ�����Լ��ϸ�ֵ60�Ϳճ�����10var option = {
backgroundColor: '#098',title: {
text: '�¶ȼ�',show: false},yAxis: [{
show: false,data: [],min: 0,max: 135,axisLine: {
show: false}}, {
show: false,min: 0,max: 50,}, {
type: 'category',data: ['', '', '', '', '', '', '', '', '', '', '��C'],position: 'left',offset: -80,axisLabel: {
fontSize: 10,color: 'white'},axisLine: {
show: false},axisTick: {
show: false},}], xAxis: [{
show: false,min: -10,max: 80,data: []}, {
show: false,min: -10,max: 80,data: []}, {
show: false,min: -10,max: 80,data: []}, {
show: false,min: -5,max: 80,}],series: [{
name: '��',type: 'bar',// ��Ӧ����XAxis�ĵ�һ����)������xAxisIndex: 0,data: [{
value: (TP_value + 10),//������Ǹ���ɫ�̶ȵ�label: {
normal: {
show: true,position: boxPosition,/*backgroundColor: {image: 'plugin/subway_beijing/images/power/bg5Valuebg.png',//���ֿ�ͼ},*/width: 40,height: 100,formatter: '{back| ' + TP_value + ' }{unit|��C}\n{downTxt|' + TP_txt + '}',rich: {
back: {
align: 'center',lineHeight: 50,fontSize: 40,fontFamily: 'digifacewide',color: leftColor},unit: {
fontFamily: '���ź�',fontSize: 15,lineHeight: 50,color: leftColor},downTxt: {
lineHeight: 50,fontSize: 25,align: 'center',color: '#fff'}}}}}],barWidth: 18,itemStyle: {
normal: {
color: new echarts.graphic.LinearGradient(0, 1, 0, 0, Gradient)}},z: 2}, {
name: '��',type: 'bar',xAxisIndex: 1,barGap: '-100%',data: [134],barWidth: 28,itemStyle: {
normal: {
color: '#0C2E6D',barBorderRadius: 50,}},z: 1}, {
name: '���',type: 'bar',xAxisIndex: 2,barGap: '-100%',data: [135],barWidth: 38,itemStyle: {
normal: {
color: '#4577BA',barBorderRadius: 50,}},z: 0}, {
name: 'Բ',type: 'scatter',hoverAnimation: false,data: [0],xAxisIndex: 0,symbolSize: 48,itemStyle: {
normal: {
color: '#93FE94',opacity: 1,}},z: 2}, {
name: '��Բ',type: 'scatter',hoverAnimation: false,data: [0],xAxisIndex: 1,symbolSize: 60,itemStyle: {
normal: {
color: '#0C2E6D',opacity: 1,}},z: 1}, {
name: '��Բ',type: 'scatter',hoverAnimation: false,data: [0],xAxisIndex: 2,symbolSize: 70,itemStyle: {
normal: {
color: '#4577BA',opacity: 1,}},z: 0}, {
name: '�̶�',type: 'bar',yAxisIndex: 0,xAxisIndex: 3,label: {
normal: {
show: true,position: 'left',distance: 10,color: 'white',fontSize: 14,formatter: function(params) {
if(params.dataIndex > 130 || params.dataIndex < 10) {
return '';} else {
if((params.dataIndex - 10) % 20 === 0) {
return params.dataIndex - 10;//����Ŀ̶ȵģ�����70��ʱ��̶��Ǵ�-60��ʼ���Ǵ��㿪ʼ} else {
return '';}}}}},barGap: '-100%',data: kd,barWidth: 1,itemStyle: {
normal: {
color: 'white',barBorderRadius: 120,}},z: 0}]};// ʹ�ø�ָ�����������������ʾͼ����myChart.setOption(option);</script></html>
**1.�¶ȼƵĿ̶� Ŀǰ����Ҫ���� ������ģ�**if(params.dataIndex > 130 || params.dataIndex < 10) {
return '';} else {
if((params.dataIndex - 10) === 0) {
return params.dataIndex - 70;} else {
return '';}}}
��-70�ij�-10�����Ǵ�0��ʼ�Ŀ̶���
2.��Ҫ������Ķ�����Ӧ������Ҫ��
series: [{
name: '��',type: 'bar',// ��Ӧ����XAxis�ĵ�һ����)������xAxisIndex: 0,data: [{
value: (TP_value + 10),//������Ǹ���ɫ�̶ȵ�label: {
normal: {
show: true,
�Ұ�������Ǹ�data���value:(showValue + 10)��Ϊvalue:(TP_value + 10) �˾Ϳ��Կ����Ǹ��̶������ˣ����о����Ұ�showValue ��ص�ע����
�����ҵ���Ŀ�еĽ�ͼ��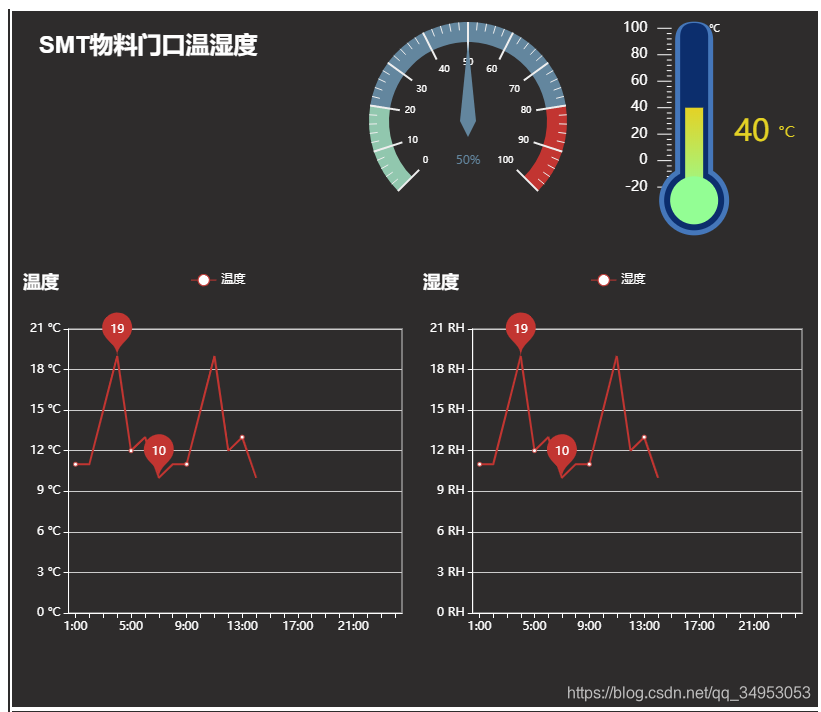
var myChart = echarts.init(document.getElementById('main14'));var TP_value = 40;var kd = [];var Gradient = [];var leftColor = '';var showValue = '';var boxPosition = [65, 0];var TP_txt = ''// �̶�ʹ����״ͼģ�⣬������1����������3������һ������for(var i = 0, len = 135; i <= len; i++) {
if(i < 10 || i > 130) {
kd.push('')} else {
if((i - 10) % 20 === 0) {
kd.push('-3');} else if((i - 10) % 4 === 0) {
kd.push('-1');} else {
kd.push('');}}}//�м��ߵĽ���ɫ���ı�����if(TP_value > 80) {
TP_txt = '';Gradient.push({
offset: 0,color: '#93FE94'}, {
offset: 0.5,color: '#E4D225'}, {
offset: 1,color: '#E01F28'})} else if(TP_value > 10) {
TP_txt = '';Gradient.push({
offset: 0,color: '#93FE94'}, {
offset: 1,color: '#E4D225'})} else {
TP_txt = '';Gradient.push({
offset: 1,color: '#93FE94'})}/* if(TP_value > 62) {showValue = 62} else {if(TP_value < -60) {showValue = -60} else {showValue = TP_value}}if(TP_value < -10) {boxPosition = [65, -120];} */leftColor = Gradient[Gradient.length - 1].color;// ��Ϊ��״��ʼ��Ϊ0���¶ȴ��ڸ�ֵ�����Լ��ϸ�ֵ60�Ϳճ�����10var option = {
// backgroundColor: '#098',title: {
text: '�¶ȼ�',show: false},yAxis: [{
show: false,data: [],min: 0,max: 135,axisLine: {
show: false}}, {
show: false,min: 0,max: 50,}, {
type: 'category',data: ['', '', '', '', '', '', '', '', '', '', '��C'],position: 'left',offset: -80,axisLabel: {
fontSize: 10,color: 'white'},axisLine: {
show: false},axisTick: {
show: false},}], xAxis: [{
show: false,min: -10,max: 80,data: []}, {
show: false,min: -10,max: 80,data: []}, {
show: false,min: -10,max: 80,data: []}, {
show: false,min: -5,max: 80,}],series: [{
name: '��',type: 'bar',// ��Ӧ����XAxis�ĵ�һ����)������xAxisIndex: 0,data: [{
value: (TP_value + 30),//������Ǹ���ɫ�̶ȵ�label: {
normal: {
show: true,position: boxPosition,width: 20,height: 100,formatter: '{back| ' + TP_value + ' }{unit|��C}\n{downTxt|' + TP_txt + '}',rich: {
back: {
align: 'center',lineHeight: 50,fontSize: 30,fontFamily: 'digifacewide',color: leftColor},unit: {
fontFamily: '���ź�',fontSize: 15,lineHeight: 50,color: leftColor},downTxt: {
lineHeight: 50,fontSize: 25,align: 'center',color: '#fff'}}}}}],barWidth: 18,itemStyle: {
normal: {
color: new echarts.graphic.LinearGradient(0, 1, 0, 0, Gradient)}},z: 2}, {
name: '��',type: 'bar',xAxisIndex: 1,barGap: '-100%',data: [134],barWidth: 28,itemStyle: {
normal: {
color: '#0C2E6D',barBorderRadius: 50,}},z: 1}, {
name: '���',type: 'bar',xAxisIndex: 2,barGap: '-100%',data: [135],barWidth: 38,itemStyle: {
normal: {
color: '#4577BA',barBorderRadius: 50,}},z: 0}, {
name: 'Բ',type: 'scatter',hoverAnimation: false,data: [0],xAxisIndex: 0,symbolSize: 48,itemStyle: {
normal: {
color: '#93FE94',opacity: 1,}},z: 2}, {
name: '��Բ',type: 'scatter',hoverAnimation: false,data: [0],xAxisIndex: 1,symbolSize: 60,itemStyle: {
normal: {
color: '#0C2E6D',opacity: 1,}},z: 1}, {
name: '��Բ',type: 'scatter',hoverAnimation: false,data: [0],xAxisIndex: 2,symbolSize: 70,itemStyle: {
normal: {
color: '#4577BA',opacity: 1,}},z: 0}, {
name: '�̶�',type: 'bar',yAxisIndex: 0,xAxisIndex: 3,label: {
normal: {
show: true,position: 'left',distance: 10,color: 'white',fontSize: 14,formatter: function(params) {
if(params.dataIndex > 130 || params.dataIndex < 10) {
return '';} else {
if((params.dataIndex - 10) % 20 === 0) {
return params.dataIndex - 30;//����Ŀ̶ȵģ�����70��ʱ��̶��Ǵ�-60��ʼ���Ǵ��㿪ʼ} else {
return '';}}}}},barGap: '-100%',data: kd,barWidth: 1,itemStyle: {
normal: {
color: 'white',barBorderRadius: 120,}},z: 0}]};// ʹ�ø�ָ�����������������ʾͼ����myChart.setOption(option);
����Dzο��ģ�https://blog.csdn.net/soldierofyou/article/details/82661263
��λ����������лл�ˣ�������СС�ĵ���