<!DOCTYPE html>
<html><head><meta charset='utf-8' /><title>聚合图</title><meta name='viewport' content='initial-scale=1,maximum-scale=1,user-scalable=no' /><link href="https://api.mapbox.com/mapbox-gl-js/v2.8.2/mapbox-gl.css" rel="stylesheet"><script src="https://api.mapbox.com/mapbox-gl-js/v2.8.2/mapbox-gl.js"></script><style>body {margin: 0;padding: 0;}#map {position: absolute;top: 0;bottom: 0;width: 100%;height: 100%;}</style>
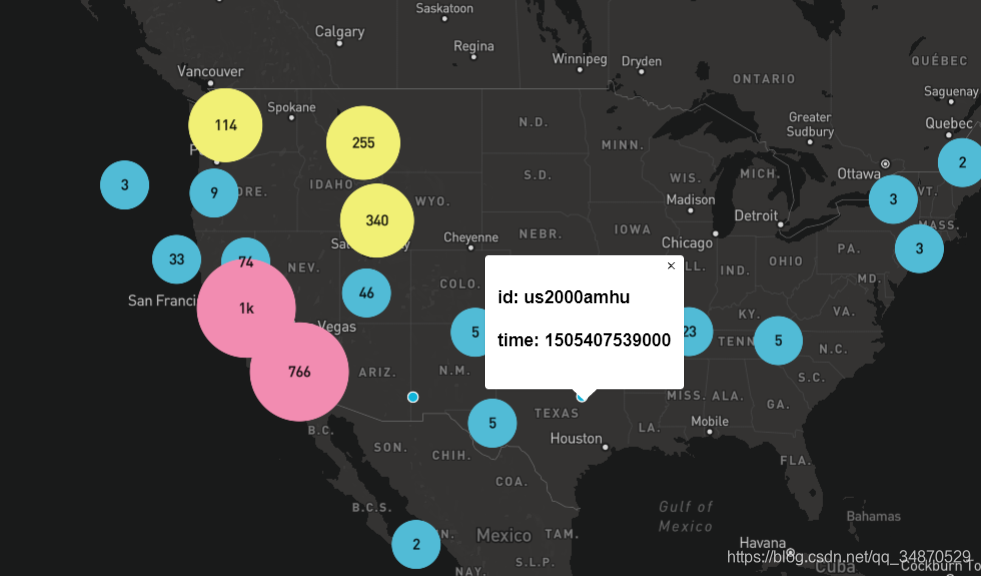
</head><body><div id='map'></div><script>mapboxgl.accessToken ='pk.eyJ1IjoibHh0aWFudGlhbiIsImEiOiJjaXd2ZjlkYnQwMTZvMnRtYWZnM2lpbHFvIn0.ef3rFZTr9psmLWahrqap2A';var map = new mapboxgl.Map({container: 'map',style: 'mapbox://styles/mapbox/light-v10',center: [-103.59179687498357, 40.66995747013945],zoom: 3});map.on('load', function () {// Add a new source from our GeoJSON data and set the// 'cluster' option to true. GL-JS will add the point_count property to your source data.// 添加数据源map.addSource("earthquakes", {type: "geojson",// Point to GeoJSON data. This example visualizes all M1.0+ earthquakes// from 12/22/15 to 1/21/16 as logged by USGS' Earthquake hazards program.data: "https://docs.mapbox.com/mapbox-gl-js/assets/earthquakes.geojson",cluster: true,clusterMaxZoom: 14, // Max zoom to cluster points onclusterRadius: 50 // Radius of each cluster when clustering points (defaults to 50)});// 添加圆形聚合图层map.addLayer({id: "clusters",type: "circle",source: "earthquakes",filter: ["has", "point_count"],paint: {// Use step expressions (https://docs.mapbox.com/mapbox-gl-js/style-spec/#expressions-step)// with three steps to implement three types of circles:// * Blue, 20px circles when point count is less than 100// * Yellow, 30px circles when point count is between 100 and 750// * Pink, 40px circles when point count is greater than or equal to 750"circle-color": ["step",["get", "point_count"],"#51bbd6",100,"#f1f075",750,"#f28cb1"],"circle-radius": ["step",["get", "point_count"],20,100,30,750,40]}});// 添加数字图层map.addLayer({id: "cluster-count",type: "symbol",source: "earthquakes",filter: ["has", "point_count"],layout: {"text-field": "{point_count_abbreviated}","text-font": ["DIN Offc Pro Medium", "Arial Unicode MS Bold"],"text-size": 12}});// 添加未聚合图层map.addLayer({id: "unclustered-point",type: "circle",source: "earthquakes",filter: ["!", ["has", "point_count"]],paint: {"circle-color": "#11b4da","circle-radius": 4,"circle-stroke-width": 1,"circle-stroke-color": "#fff"}});// inspect a cluster on click 点击聚合图层地图级别中心点变化map.on('click', 'clusters', function (e) {var features = map.queryRenderedFeatures(e.point, {layers: ['clusters']});console.log('features', features);var clusterId = features[0].properties.cluster_id;map.getSource('earthquakes').getClusterExpansionZoom(clusterId, function (err, zoom) {if (err) return;map.easeTo({center: features[0].geometry.coordinates,zoom: zoom});});// 获取当前聚合点下一级子元素map.getSource('earthquakes').getClusterChildren(clusterId, (error, features) => {if (!error) {console.log('Cluster children:', features);}});// 获取当前聚合点下边的所有子元素let allFeatures = [];const getFeatures = (id) => {map.getSource('earthquakes').getClusterChildren(id, (error, features) => {features.forEach(feature => {const {id=''} = feature;id && getFeatures(id);!id && allFeatures.push(feature);console.log('allFeatures', allFeatures);});});};getFeatures(clusterId);});// 聚合图层鼠标移入样式map.on('mouseenter', 'clusters', function (e) {console.log('cluster', e);map.getCanvas().style.cursor = 'pointer';});// 聚合图层鼠标移出鼠标样式map.on('mouseleave', 'clusters', function () {map.getCanvas().style.cursor = '';});let popup = new mapboxgl.Popup({className: 'my-class'});// 未聚合图层鼠标移入pop框显示map.on('mouseenter', 'unclustered-point', function (e) {console.log(e)// 改变鼠标样式map.getCanvas().style.cursor = 'pointer';let features = e.features[0].properties;popup.setLngLat(e.lngLat)popup.setHTML(`<h3>id: ${features.id}</h3><h3>time: ${features.time}</h3>`)popup.setMaxWidth("300px")popup.addTo(map);});// 未聚合图层鼠标移出pop框隐藏map.on('mouseleave', 'unclustered-point', function () {// 改变鼠标样式map.getCanvas().style.cursor = '';popup.remove();});});</script></body></html>效果展示: