The most common problems and outages in a Kubernetes cluster come from coreDNS, so learning how to monitor coreDNS is crucial.
Kubernetes 集群中最常见的问题和中断来自 coreDNS,因此学习如何监控 coreDNS 至关重要。
Imagine that your frontend application suddenly goes down. After some time investigating, you discover it’s not resolving the backend endpoint because the DNS keeps returning 500 error codes. The sooner you can get to this conclusion, the faster you can recover your application.
想象一下,您的前端应用程序突然宕机了。经过一段时间的调查,您发现它没有解析后端端点,因为 DNS 不断返回 500 错误代码。您越早得出这个结论,您就可以越快地恢复您的应用程序。
Monitoring your coreDNS can give you time to fix issues before your cluster decides to go down at the worst moment and it’s too late.
监控您的 coreDNS 可以让您有时间在集群决定在最糟糕的时刻宕机之前解决问题,但为时已晚。

What is coreDNS?
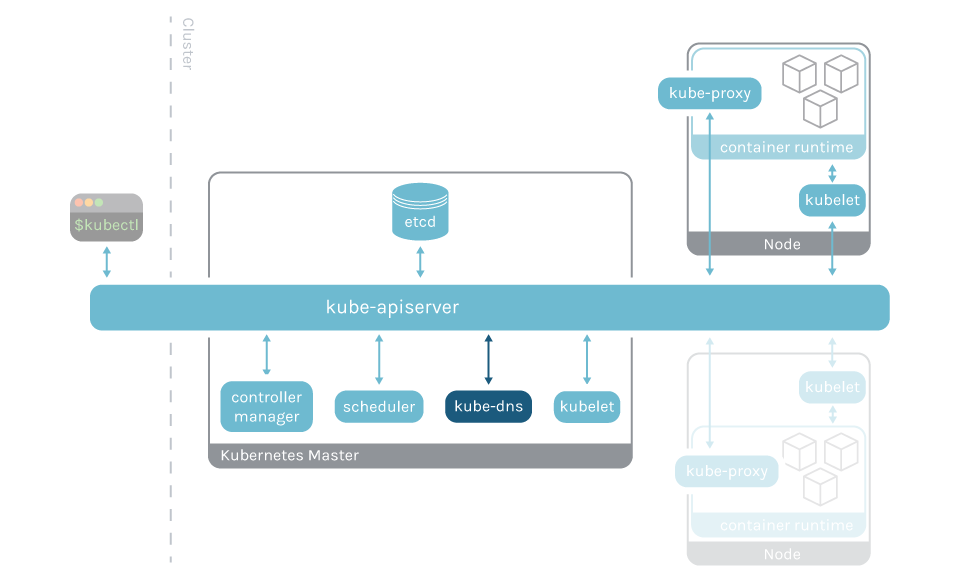
CoreDNS is the default kube-dns since version v1.12 of Kubernetes, and it’s the recommended DNS server. It’s a key component, as each pod and service has a fully qualified domain name (FQDN). If kube-dns goes down, all of your cluster goes down.
CoreDNS 是自 Kubernetes v1.12 版本以来的默认 kube-dns,它是推荐的 DNS 服务器。这是一个关键组件,因为每个 Pod 和服务都有一个完全限定的域名 (FQDN)。如果 kube-dns 出现故障,您的所有集群都会出现故障。
How to monitor coreDNS
You usually see coreDNS running in your master node, but it can also run bare metal to provide service discovery in non-Kubernetes environments that use containers, like Docker.
Getting metrics from coreDNS
CoreDNS is instrumented and, like the rest of the components of the Kubernetes control plane, exposes Prometheus metrics in the port 9153. It provides information about requests to the DNS server and the plugins inside. Depending on the size of the cluster, the replicas can be one or more. You’ll need to scrape CoreDNS on each replica.
CoreDNS 被检测,并且与 Kubernetes 控制平面的其他组件一样,在端口 9153 中公开 Prometheus 指标。它提供有关对 DNS 服务器和内部插件的请求的信息。根据集群的大小,副本可以是一个或多个。您需要在每个副本上抓取 CoreDNS。
You can get the metrics accessing to the endpoint:
curl localhost:9153/metrics[root@master ~]# kubectl get pod -n kube-system -o wide
NAME                                       READY   STATUS    RESTARTS   AGE     IP              NODE     NOMINATED NODE   READINESS GATES
coredns-867b49865c-f6qbh                   1/1     Running   3          2d20h   10.233.96.21    node2    <none>           <none>
coredns-867b49865c-m9hx4                   1/1     Running   3          2d20h   10.233.90.16    node1    <none>           <none>[root@master ~]# curl http://10.233.96.21:9153/metrics
# HELP coredns_build_info A metric with a constant '1' value labeled by version, revision, and goversion from which CoreDNS was built.
# TYPE coredns_build_info gauge
coredns_build_info{goversion="go1.14.1",revision="1766568",version="1.6.9"} 1
# HELP coredns_cache_hits_total The count of cache hits.
# TYPE coredns_cache_hits_total counter
coredns_cache_hits_total{server="dns://:53",type="denial"} 15
coredns_cache_hits_total{server="dns://:53",type="success"} 9
# HELP coredns_cache_misses_total The count of cache misses.
# TYPE coredns_cache_misses_total counter
coredns_cache_misses_total{server="dns://:53"} 15
# HELP coredns_cache_size The number of elements in the cache.
# TYPE coredns_cache_size gauge
coredns_cache_size{server="dns://:53",type="denial"} 9
coredns_cache_size{server="dns://:53",type="success"} 3
# HELP coredns_dns_request_count_total Counter of DNS requests made per zone, protocol and family.
# TYPE coredns_dns_request_count_total counter
coredns_dns_request_count_total{family="1",proto="tcp",server="dns://:53",zone="."} 29
coredns_dns_request_count_total{family="1",proto="udp",server="dns://:53",zone="."} 10
# HELP coredns_dns_request_duration_seconds Histogram of the time (in seconds) each request took.
# TYPE coredns_dns_request_duration_seconds histogram
coredns_dns_request_duration_seconds_bucket{server="dns://:53",type="A",zone=".",le="0.00025"} 14
coredns_dns_request_duration_seconds_bucket{server="dns://:53",type="A",zone=".",le="0.0005"} 14
coredns_dns_request_duration_seconds_bucket{server="dns://:53",type="A",zone=".",le="0.001"} 15
And it will return a long list of metrics with this structure (truncated):
# HELP coredns_build_info A metric with a constant '1' value labeled by version, revision, and goversion from which CoreDNS was built.
# TYPE coredns_build_info gauge
coredns_build_info{goversion="go1.14.4",revision="f59c03d",version="1.7.0"} 1
# HELP coredns_cache_entries The number of elements in the cache.
# TYPE coredns_cache_entries gauge
coredns_cache_entries{server="dns://:53",type="denial"} 41
coredns_cache_entries{server="dns://:53",type="success"} 15
# HELP coredns_cache_hits_total The count of cache hits.
# TYPE coredns_cache_hits_total counter
coredns_cache_hits_total{server="dns://:53",type="denial"} 366066
coredns_cache_hits_total{server="dns://:53",type="success"} 135
# HELP coredns_cache_misses_total The count of cache misses.
# TYPE coredns_cache_misses_total counter
coredns_cache_misses_total{server="dns://:53"} 106654
# HELP coredns_dns_request_duration_seconds Histogram of the time (in seconds) each request took.
# TYPE coredns_dns_request_duration_seconds histogram
coredns_dns_request_duration_seconds_bucket{server="dns://:53",type="A",zone=".",le="0.00025"} 189356
coredns_dns_request_duration_seconds_bucket{server="dns://:53",type="A",zone=".",le="0.0005"} 189945
coredns_dns_request_duration_seconds_bucket{server="dns://:53",type="A",zone=".",le="0.001"} 190102
coredns_dns_request_duration_seconds_bucket{server="dns://:53",type="A",zone=".",le="0.002"} 235026
下面是一些coredns自身相关的指标:
coredns_build_info(表压)
的公制以恒定的“1”由版本,修订版本和goversion从中CoreDNS建标记值。coredns_cache_hits_total(累积)
缓存未命中数。coredns_cache_misses_total(累积)
缓存未命中数。coredns_cache_size(累积)
DNS 缓存的大小。coredns_dns_request_count_total(累积)
按区域、协议和系列发出的 DNS 请求计数器。coredns_dns_request_duration_seconds(累积)
每个请求所用时间(以秒为单位)的直方图。(和)coredns_dns_request_duration_seconds_bucket
每个请求所用时间(以秒为单位)coredns_dns_request_duration_seconds_count(累积)
每个请求所用时间(以秒为单位)的直方图。(数数)coredns_dns_request_size_bytes(累积)
EDNS0 UDP 缓冲区的大小(以字节为单位)coredns_dns_request_size_bytes_bucket
EDNS0 UDP 缓冲区的大小(以字节为单位)(TCP 为 64K)。(桶)coredns_dns_request_size_bytes_count(累积)
EDNS0 UDP 缓冲区的大小(以字节为单位)(TCP 为 64K)。(数数)coredns_dns_request_type_count_total(累积)
每种类型、每个区域的 DNS 请求计数器。coredns_dns_response_rcode_count_total
响应状态代码的计数器。coredns_dns_response_size_bytes(累积)
返回响应的大小(以字节为单位)。(和)coredns_dns_response_size_bytes_bucket(累积)
返回响应的大小(以字节为单位)。(桶)coredns_dns_response_size_bytes_count(累积)
返回响应的大小(以字节为单位)。(数数)coredns_health_request_duration_seconds(累积)
每个请求所用时间(以秒为单位)的直方图。(和)coredns_health_request_duration_seconds_bucket(累积)
每个请求所用时间(以秒为单位)的直方图。(桶)coredns_health_request_duration_seconds_count(累积)
每个请求所用时间(以秒为单位)的直方图。(数数)coredns_panic_count_total(累积)
一个计算恐慌次数的指标。coredns_proxy_request_count_total(累积)
每个协议、代理协议、家族和上游的请求计数器。coredns_proxy_request_duration_seconds(累积)
每个请求所用时间(以秒为单位)的直方图。(和)coredns_proxy_request_duration_seconds_bucket(累积)
每个请求所用时间(以秒为单位)的直方图。(桶)coredns_proxy_request_duration_seconds_count(累积)
每个请求所用时间(以秒为单位)的直方图。(数数)
To monitor coreDNS with Prometheus, you just have to add the corresponding job:
- job_name: kube-dnshonor_labels: truekubernetes_sd_configs:- role: podrelabel_configs:- action: keepsource_labels:- __meta_kubernetes_namespace- __meta_kubernetes_pod_nameseparator: '/'regex: 'kube-system/coredns.+'- source_labels:- __meta_kubernetes_pod_container_port_nameaction: keepregex: metrics- source_labels:- __meta_kubernetes_pod_nameaction: replacetarget_label: instance- action: labelmapregex: __meta_kubernetes_pod_label_(.+)
Monitor coreDNS: What to look for?
Disclaimer: coreDNS metrics might differ between Kubernetes versions. Here, we used the Kubernetes 1.18 and the coreDNS version. You can check the metrics available for your version in the Kubernetes repo (link for the 1.18.8 version).
免责声明:不同 Kubernetes 版本的coreDNS指标可能不同。在这里,我们使用了 Kubernetes 1.18 和 coreDNS 版本。您可以在Kubernetes 存储库(1.18.8 版本的链接)中检查适用于您的版本的指标。
Request latency: Following the golden signals, the latency of a request is an important metric to detect any degradation in the service. To check this, you have to always compare the percentile against the average. The way to do this in Prometheus is by using the operator histogram.
请求延迟:根据黄金信号,请求的延迟是检测服务质量下降的重要指标。要检查这一点,您必须始终将百分位数与平均值进行比较。在 Prometheus 中执行此操作的方法是使用运算符histogram。
coredns_dns_request_duration_seconds_bucket
histogram_quantile(0.99, sum(rate(coredns_dns_request_duration_seconds_bucket{job="kube-dns"}[5m])) by(server, zone, le))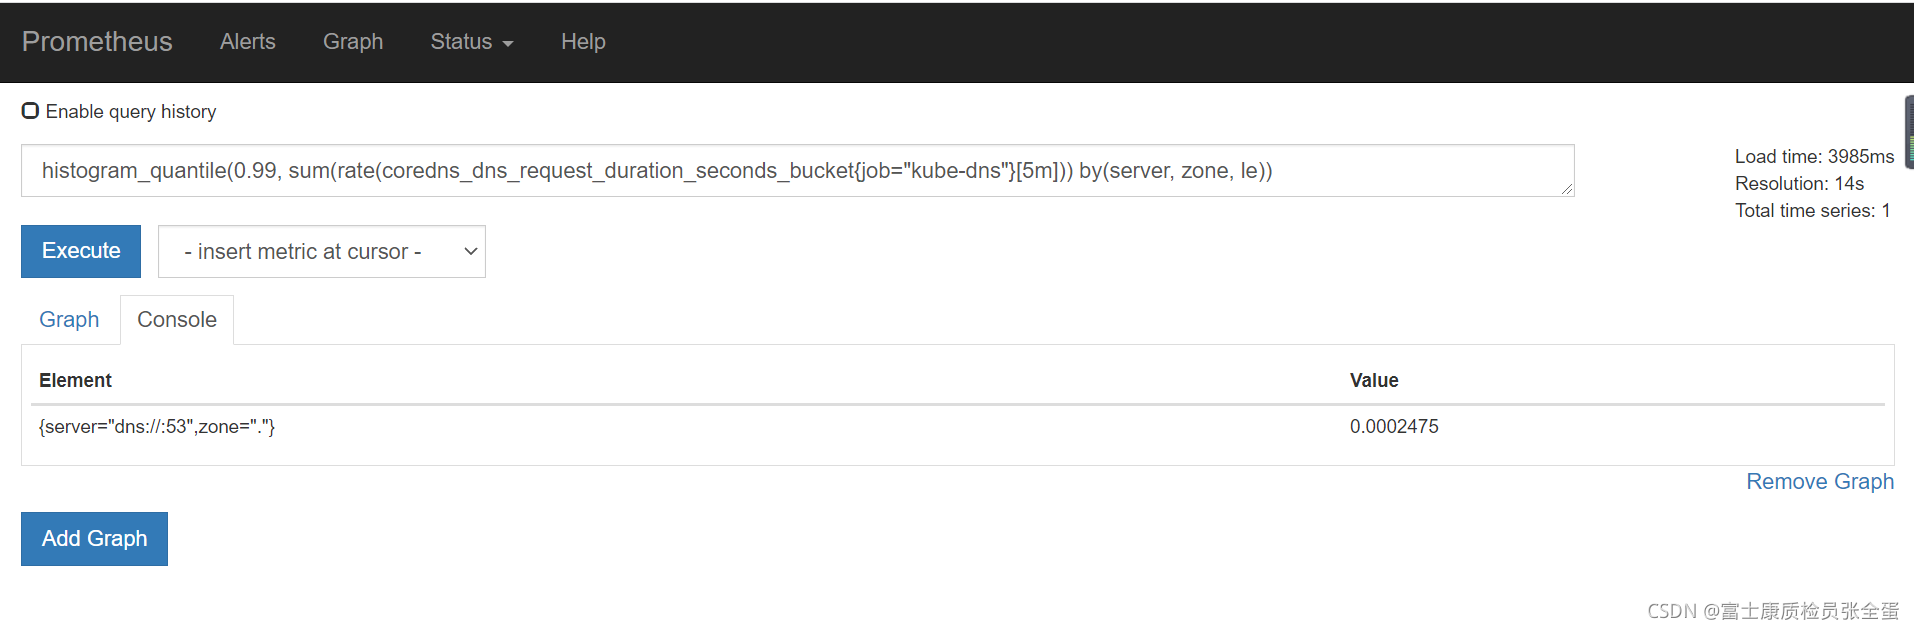 Error rate: The error rate is another golden signal you have to monitor. Although errors are not always caused by the DNS failing, it’s still a key metric that you have to watch carefully. One of the key metrics of coreDNS about errors is
 coredns_dns_responses_total, and the code is also relevant. For example, the NXDOMAIN error means that a DNS query failed because the domain name queried does not exist.
错误率:错误率是您必须监控的另一个黄金信号。尽管错误并不总是由 DNS 故障引起的,但它仍然是您必须仔细观察的关键指标。coreDNS 关于错误的关键指标之一是coredns_dns_responses_total, 并且code也是相关的。例如,该NXDOMAIN错误表示 DNS 查询失败,因为查询的域名不存在。
# HELP coredns_dns_responses_total Counter of response status codes.
# TYPE coredns_dns_responses_total counter
coredns_dns_responses_total{rcode="NOERROR",server="dns://:53",zone="."} 1336
coredns_dns_responses_total{rcode="NXDOMAIN",server="dns://:53",zone="."} 471519
coredns_dns_response_rcode_count_total{rcode="NXDOMAIN",server="dns://:53",zone="."}
coredns_dns_response_rcode_count_total{rcode="NOERROR",server="dns://:53",zone="."}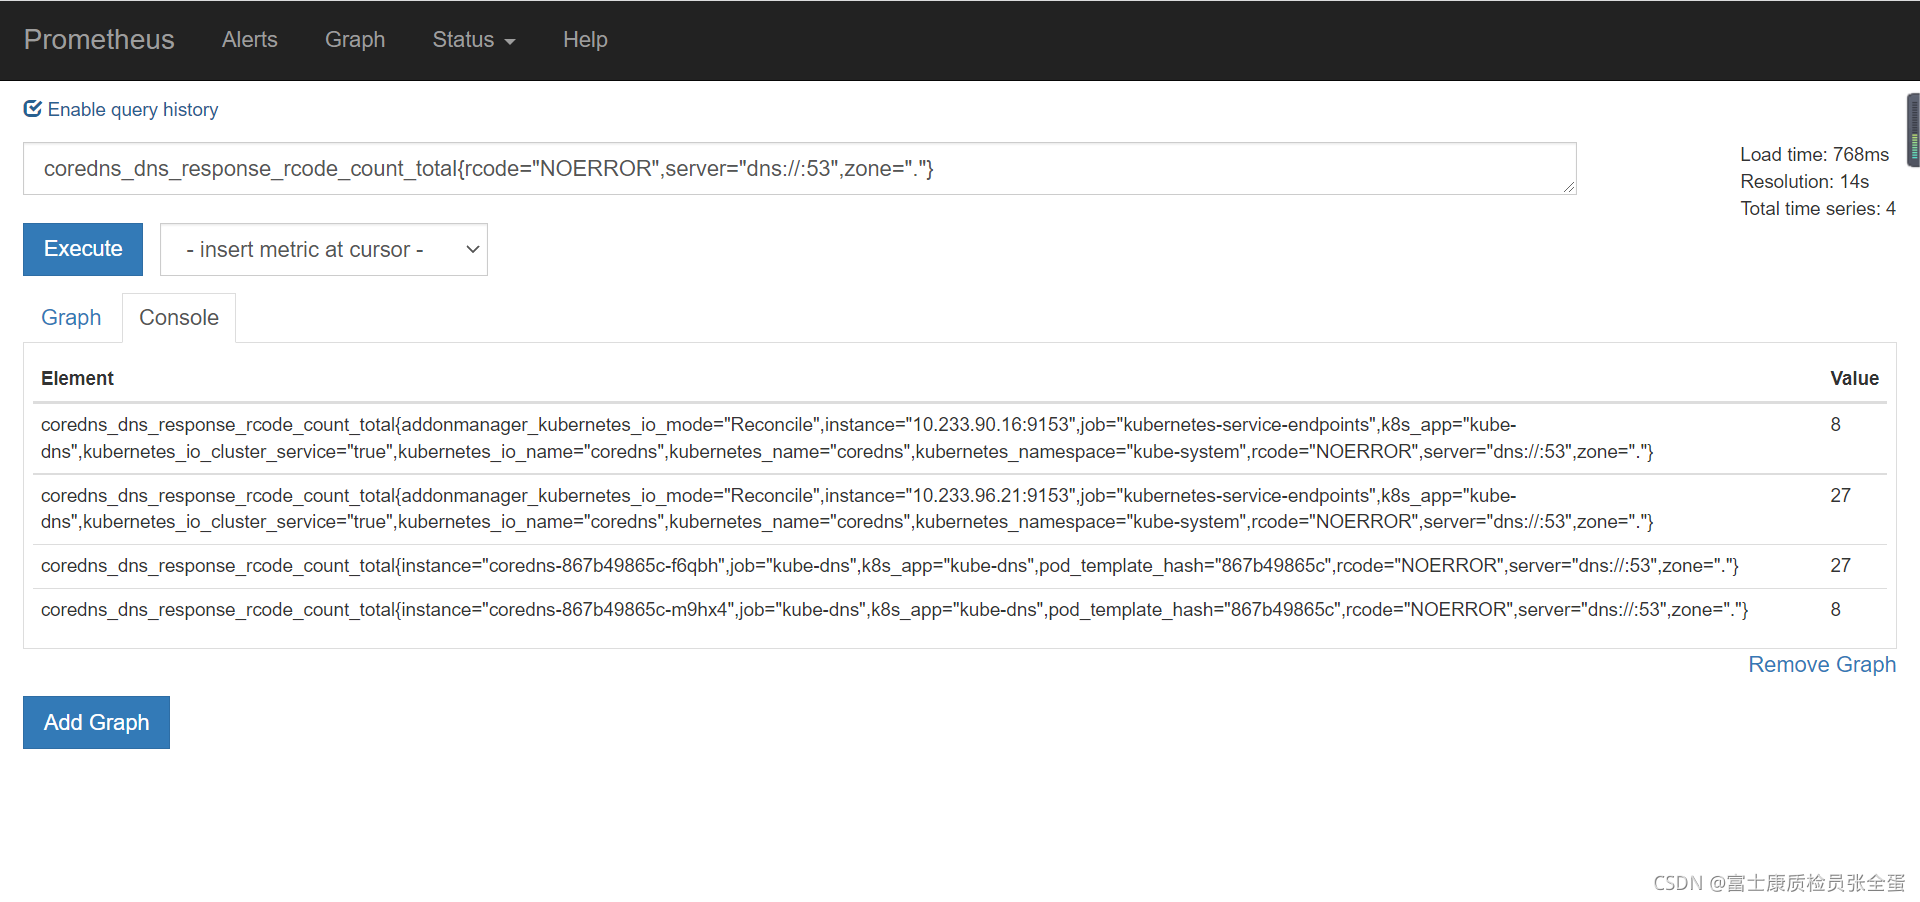
https://monitoring.mixins.dev/coredns/ https://monitoring.mixins.dev/coredns/
CoreDNS dashboard for Grafana | Grafana Labs
CoreDNSDown
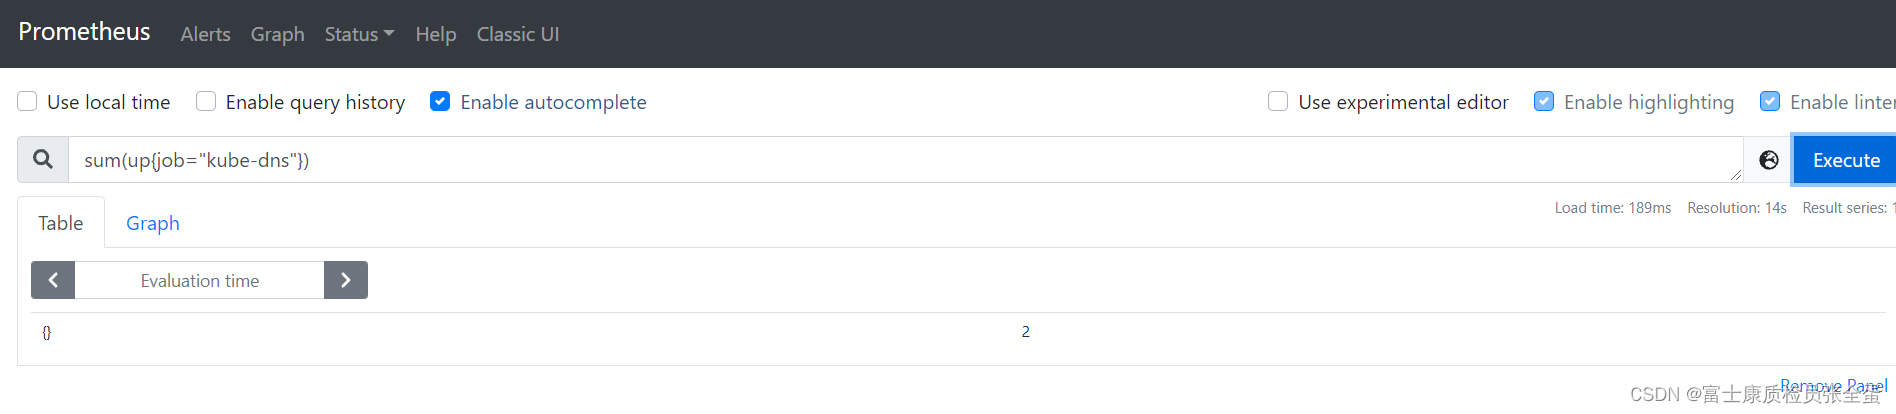
alert: CoreDNSDown
annotations:message: CoreDNS has disappeared from Prometheus target discovery.runbook_url: https://github.com/povilasv/coredns-mixin/tree/master/runbook.md#alert-name-corednsdown
expr: |sum(up{job="kube-dns"})  == 1
for: 15m
labels:severity: critical
CoreDNSErrorsHigh
coredns_dns_request_type_count_total
每种类型、每个区域的 DNS 请求计数器
alert: CoreDNSErrorsHigh
annotations:message: CoreDNS is returning SERVFAIL for {
   { $value | humanizePercentage }} ofrequests.runbook_url: https://github.com/povilasv/coredns-mixin/tree/master/runbook.md#alert-name-corednserrorshigh
expr: |sum(rate(coredns_dns_response_rcode_count_total{job="kube-dns",rcode="NXDOMAIN"}[5m]))/sum(rate(coredns_dns_response_rcode_count_total{job="kube-dns"}[5m])) > 0.03
for: 10m
labels:severity: critical
CoreDNSLatencyHigh
alert: CoreDNSLatencyHigh
annotations:message: CoreDNS has 99th percentile latency of {
   { $value }} seconds for server{
   { $labels.server }} zone {
   { $labels.zone }} .runbook_url: https://github.com/povilasv/coredns-mixin/tree/master/runbook.md#alert-name-corednslatencyhigh
expr: |histogram_quantile(0.99, sum(rate(coredns_dns_request_duration_seconds_bucket{job="kube-dns"}[5m])) by(server, zone, le)) > 4
for: 10m
labels:severity: critical