文章目录
-
-
- 1. 安装graphviz
-
- 1.1 下载 graphviz (windows 环境)
- 1.2 测试graphviz是否安装成功
- 2. 使用pprof
-
- 2.1 修改代码
- 2.2 火焰图生成
- 3. Gin框架使用pprof
-
- 3.1 安装需要包
- 3.2 启动程序
- 3.3 火焰图
- 3.4 pprof命令行
- 参考文档
-
1. 安装graphviz
1.1 下载 graphviz (windows 环境)
https://graphviz.gitlab.io/_pages/Download/windows/graphviz-2.38.msi
下载完之后安装,安装完成之后将graphviz的安装bin目录加入环境变量中
# 例如
C:\Program Files (x86)\Graphviz2.38\bin
1.2 测试graphviz是否安装成功
dot -version
dot - graphviz version 2.38.0 (20140413.2041)
libdir = "C:\Program Files (x86)\Graphviz2.38\bin"
Activated plugin library: gvplugin_dot_layout.dll
Using layout: dot:dot_layout
Activated plugin library: gvplugin_core.dll
Using render: dot:core
Using device: dot:dot:core
The plugin configuration file:C:\Program Files (x86)\Graphviz2.38\bin\config6was successfully loaded.render      :  cairo dot fig gd gdiplus map pic pov ps svg tk vml vrml xdotlayout      :  circo dot fdp neato nop nop1 nop2 osage patchwork sfdp twopitextlayout  :  textlayoutdevice      :  bmp canon cmap cmapx cmapx_np dot emf emfplus eps fig gd gd2 gif gv imap imap_np ismap jpe jpeg jpg metafile pdf pic plain plain-ext png pov ps ps2 svg svgz tif tiff tk vml vmlz vrml wbmp xdot xdot1.2 xdot1.4loadimage   :  (lib) bmp eps gd gd2 gif jpe jpeg jpg png ps svg
2. 使用pprof
2.1 修改代码
main.go
import "net/http"
import _ "net/http/pprof"
func main() {
    http.ListenAndServe("0.0.0.0:8080", nil)
}
启动程序
go run main.go
# 通过浏览器访问
http://127.0.0.1:8080/debug/pprof/
# 访问该地址将看到性能分析界面
2.2 火焰图生成
在命令行下执行
go tool pprof -http=:1234 http://localhost:8080/debug/pprof/profile
# 执行上述命令稍微等会,浏览器上会出现一UI界面
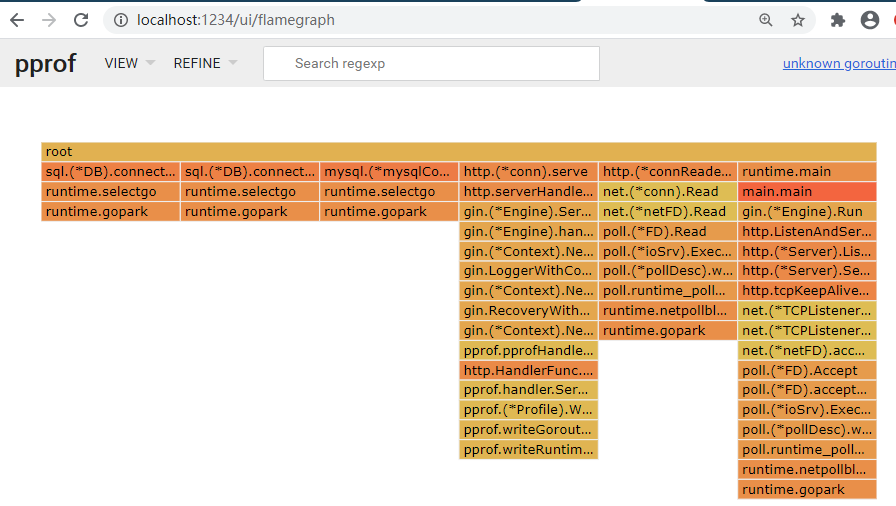
VIEW->Flame Graph
看到火焰图
3. Gin框架使用pprof
3.1 安装需要包
进入项目根目录,安装gin使用的pprof包
go get github.com/gin-contrib/pprof
在项目中使用pprof
example:
package mainimport ("github.com/gin-contrib/pprof""github.com/gin-gonic/gin"
)func main() {
    router := gin.Default()pprof.Register(router)router.Run(":8080")
}
3.2 启动程序
启动程序之后会看到很多自动添加pprof 相关的接口
通过这些接口我们可以进行分析
go run main.go
[GIN-debug] [WARNING] Creating an Engine instance with the Logger and Recovery middleware already attached.[GIN-debug] [WARNING] Running in "debug" mode. Switch to "release" mode in production.- using env:   export GIN_MODE=release- using code:  gin.SetMode(gin.ReleaseMode)[GIN-debug] GET    /debug/pprof/             --> github.com/gin-contrib/pprof.pprofHandler.func1 (3 handlers)
[GIN-debug] GET    /debug/pprof/cmdline      --> github.com/gin-contrib/pprof.pprofHandler.func1 (3 handlers)
[GIN-debug] GET    /debug/pprof/profile      --> github.com/gin-contrib/pprof.pprofHandler.func1 (3 handlers)
[GIN-debug] POST   /debug/pprof/symbol       --> github.com/gin-contrib/pprof.pprofHandler.func1 (3 handlers)
[GIN-debug] GET    /debug/pprof/symbol       --> github.com/gin-contrib/pprof.pprofHandler.func1 (3 handlers)
[GIN-debug] GET    /debug/pprof/trace        --> github.com/gin-contrib/pprof.pprofHandler.func1 (3 handlers)
[GIN-debug] GET    /debug/pprof/allocs       --> github.com/gin-contrib/pprof.pprofHandler.func1 (3 handlers)
[GIN-debug] GET    /debug/pprof/block        --> github.com/gin-contrib/pprof.pprofHandler.func1 (3 handlers)
[GIN-debug] GET    /debug/pprof/goroutine    --> github.com/gin-contrib/pprof.pprofHandler.func1 (3 handlers)
[GIN-debug] GET    /debug/pprof/heap         --> github.com/gin-contrib/pprof.pprofHandler.func1 (3 handlers)
[GIN-debug] GET    /debug/pprof/mutex        --> github.com/gin-contrib/pprof.pprofHandler.func1 (3 handlers)
[GIN-debug] GET    /debug/pprof/threadcreate --> github.com/gin-contrib/pprof.pprofHandler.func1 (3 handlers)...
[GIN-debug] Environment variable PORT is undefined. Using port :8080 by default
[GIN-debug] Listening and serving HTTP on :8080
通过浏览器访问
http://127.0.0.1:8080/debug/pprof/
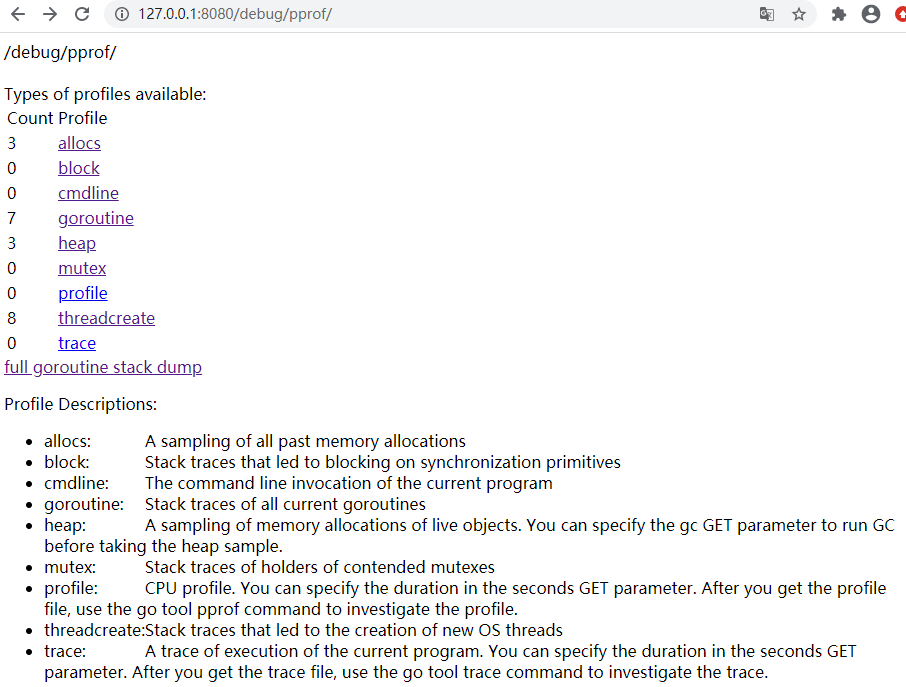
allocs :过去所有内存分配的抽样
block :导致在同步基元上阻塞的堆栈跟踪
cmdline :当前程序的命令行调用
goroutine :goroutine堆栈跟踪
heap :活动对象的内存分配的采样
mutex :争用互斥锁的持有者的堆栈跟踪
profile :CPU摘要信息。您可以在seconds GET参数中指定持续时间。获得概要文件之后,使用go工具pprof命令来调查该概要文件。
threadcreate : 操作系统线程堆栈跟踪
trace : 当前程序的执行轨迹。您可以在seconds GET参数中指定持续时间。获得跟踪文件后,使用go工具跟踪命令来调查跟踪。
3.3 火焰图
在新的命令行窗口
# 执行命令后,会在浏览器打开一个窗口
go tool pprof -http=:1234 http://localhost:8080/debug/pprof/goroutine# 简单解释
# -http 表示使用交互式web接口查看获取的性能信息,指定可用的端口即可
# debug/pprof/需要查看的指标 (allocs,block,goroutine,heap...)
在浏览器中能看到如下的性能分析图:
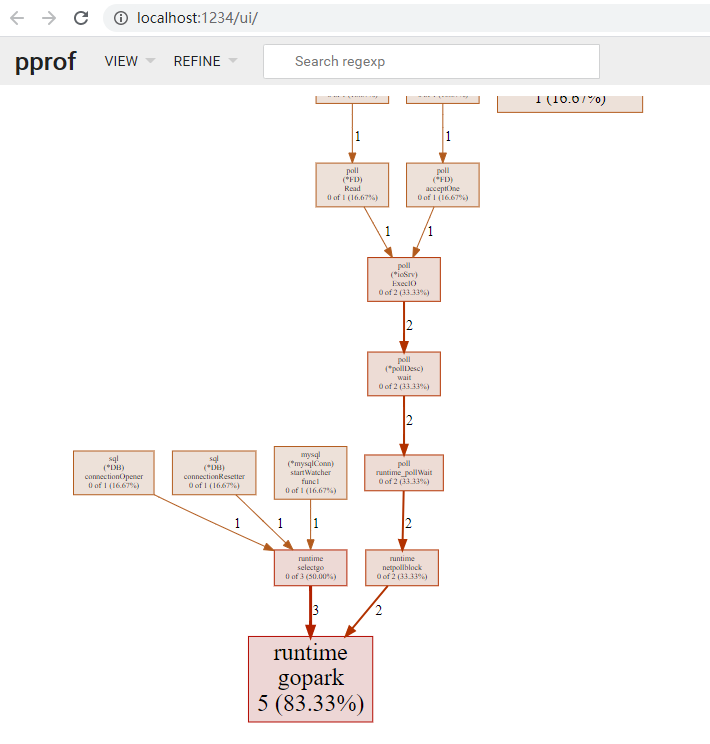
火焰图:
3.4 pprof命令行
在命令行下可以看到性能数据
使用
go tool pprof+ 数据源example :
go tool pprof http://127.0.0.1:8080/debug/pprof/allocs
命令行下执行 ,常用的命令有top,tree,web等,通过help命令查看更多
PS G:\> go tool pprof http://127.0.0.1:8080/debug/pprof/allocs
Fetching profile over HTTP from http://127.0.0.1:8080/debug/pprof/allocs
Saved profile in C:\Users\captain\pprof\pprof.alloc_objects.alloc_space.inuse_objects.inuse_space.008.pb.gz
Type: alloc_space
Time: Sep 19, 2020 at 3:53pm (CST)
Entering interactive mode (type "help" for commands, "o" for options)
(pprof)
# help 命令可以查看所有命令
# top [n] 查看性能指标数据
(pprof) top 5
Showing nodes accounting for 1026.66kB, 100% of 1026.66kB total
Showing top 5 nodes out of 11flat flat% sum% cum cum%514.63kB 50.13% 50.13% 514.63kB 50.13% math/rand.NewSource512.03kB 49.87% 100% 512.03kB 49.87% regexp/syntax.(*parser).maybeConcat0 0% 100% 512.03kB 49.87% github.com/jinzhu/gorm.init.ializers0 0% 100% 514.63kB 50.13% math/rand.init.ializers0 0% 100% 512.03kB 49.87% regexp.Compile
# tree [n] 以树形显示指标数据
(pprof) tree 5
Showing nodes accounting for 1026.66kB, 100% of 1026.66kB total
Showing top 5 nodes out of 11
----------------------------------------------------------+-------------flat flat% sum% cum cum% calls calls% + context
----------------------------------------------------------+-------------514.63kB 100% | math/rand.init.ializers514.63kB 50.13% 50.13% 514.63kB 50.13% | math/rand.NewSource
----------------------------------------------------------+-------------512.03kB 100% | regexp.Compile512.03kB 49.87% 100% 512.03kB 49.87% | regexp/syntax.(*parser).maybeConcat
----------------------------------------------------------+-------------0 0% 100% 512.03kB 49.87% | github.com/jinzhu/gorm.init.ializers512.03kB 100% | regexp.Compile
----------------------------------------------------------+-------------0 0% 100% 514.63kB 50.13% | math/rand.init.ializers514.63kB 100% | math/rand.NewSource
----------------------------------------------------------+-------------512.03kB 100% | github.com/jinzhu/gorm.init.ializers0 0% 100% 512.03kB 49.87% | regexp.Compile512.03kB 100% | regexp/syntax.(*parser).maybeConcat
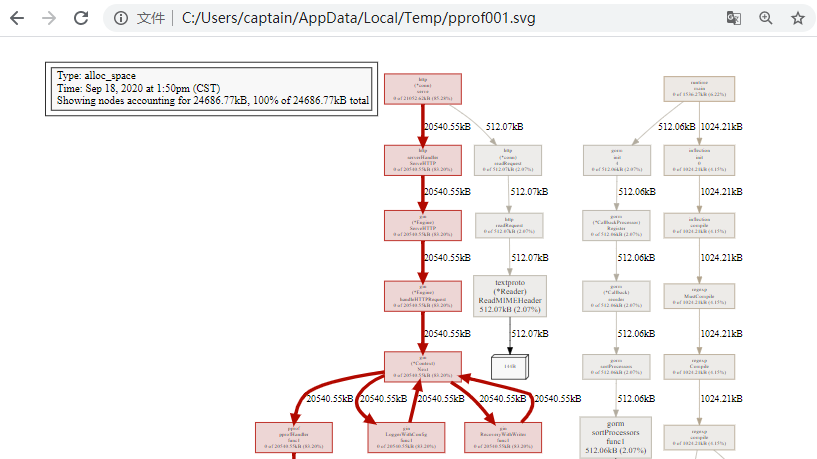
----------------------------------------------------------+------------- # web命令是希望通过web形式(在浏览器器中看到),因为前面已经安装了graphviz,所以web可以使用
# web命令会直接打开浏览器
(pprof) web
参考文档
- [1] gin-contrib/pprof
- [2] pprof