python3 Dense SIFT算法的应用与实现
-
Dense SIFT
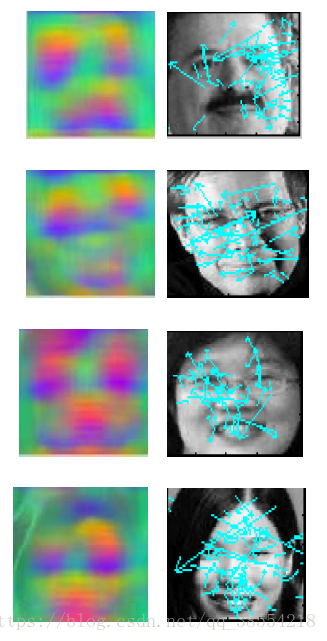
因为课题的需求,传统的SIFT算法即Sparse SIFT,不能很好地表征不同类之间的特征差异,达不到所需的分类要求。而Dense SIFT算法,是一种对输入图像进行分块处理,再进行SIFT运算的特征提取过程。Dense SIFT根据可调的参数大小,来适当满足不同分类任务下对图像的特征表征能力。而Sparse SIFT则是对整幅图像的处理,得到一系列特征点(keypoints)。如下图所示:
在此背景下,通常来讲Dense SIFT更适用于图像分类识别的任务,而Sparse SIFT更适用于图像检索分割的任务。 -
Dense SIFT的代码实现
原代码为python2,现用python3重新编译:
import numpy as np
from scipy import signal
from matplotlib import pyplot
import matplotlib# sift features
Nangles = 8
Nbins = 4
Nsamples = Nbins**2
alpha = 9.0
angles = np.array(range(Nangles))*2.0*np.pi/Nanglesdef gen_dgauss(sigma):'''generating a derivative of Gauss filter on both the X and Ydirection.//在X和Y方向上生成高斯滤波器的导数。'''fwid = np.int(2*np.ceil(sigma))G = np.array(range(-fwid,fwid+1))**2G = G.reshape((G.size,1)) + GG = np.exp(- G / 2.0 / sigma / sigma)G /= np.sum(G)GH,GW = np.gradient(G)GH *= 2.0/np.sum(np.abs(GH))GW *= 2.0/np.sum(np.abs(GW))return GH,GWclass DsiftExtractor:'''The class that does dense sift feature extractor.//进行密集筛选的类提取器Sample Usage:extractor = DsiftExtractor(gridSpacing,patchSize,[optional params])feaArr,positions = extractor.process_image(Image)'''def __init__(self, gridSpacing, patchSize,nrml_thres = 1.0,\sigma_edge = 0.8,\sift_thres = 0.2):'''gridSpacing: the spacing for sampling dense descriptors//密集描述符的采样间隔patchSize: the size for each sift patch//每个sift patch的尺寸nrml_thres: low contrast normalization threshold//低对比度归一化阈值sigma_edge: the standard deviation for the gaussian smoothing//高斯平滑的标准差before computing the gradientsift_thres: sift thresholding (0.2 works well based onLowe's SIFT paper)//sift阈值化(0.2基于Lowe's sift paper效果很好)'''self.gS = gridSpacingself.pS = patchSizeself.nrml_thres = nrml_thresself.sigma = sigma_edgeself.sift_thres = sift_thres# compute the weight contribution mapsample_res = self.pS / np.double(Nbins)sample_p = np.array(range(self.pS))sample_ph, sample_pw = np.meshgrid(sample_p,sample_p)sample_ph.resize(sample_ph.size)sample_pw.resize(sample_pw.size)bincenter = np.array(range(1,Nbins*2,2)) / 2.0 / Nbins * self.pS - 0.5 bincenter_h, bincenter_w = np.meshgrid(bincenter,bincenter)bincenter_h.resize((bincenter_h.size,1))bincenter_w.resize((bincenter_w.size,1))dist_ph = abs(sample_ph - bincenter_h)dist_pw = abs(sample_pw - bincenter_w)weights_h = dist_ph / sample_resweights_w = dist_pw / sample_resweights_h = (1-weights_h) * (weights_h <= 1)weights_w = (1-weights_w) * (weights_w <= 1)# weights is the contribution of each pixel to the corresponding bin centerself.weights = weights_h * weights_w#pyplot.imshow(self.weights)#pyplot.show()def process_image(self, image, positionNormalize = True,\verbose = True):'''processes a single image, return the locationsand the values of detected SIFT features.//处理单个图像,返回检测到的SIFT特征的位置和值。image: a M*N image which is a numpy 2D array. If you pass a color image, it will automatically be convertedto a grayscale image.//一个M*N的图像,它是一个numpy二维数组。如果您传递一个彩色图像,它将自动转换为灰度图像。positionNormalize: whether to normalize the positionsto [0,1]. If False, the pixel-based positions of thetop-right position of the patches is returned.//是否将位置规范化为[0,1]。如果为False,则返回补丁右上角的基于像素的位置。Return values:feaArr: the feature array, each row is a feature//特征数组,每一行都是一个特征positions: the positions of the features//特征的位置'''image = image.astype(np.double)if image.ndim == 3:# we do not deal with color images.image = np.mean(image,axis=2)# compute the gridsH,W = image.shapegS = self.gSpS = self.pSremH = np.mod(H-pS, gS)remW = np.mod(W-pS, gS)offsetH = remH//2offsetW = remW//2gridH,gridW = np.meshgrid(range(offsetH,H-pS+1,gS), range(offsetW,W-pS+1,gS))gridH = gridH.flatten()gridW = gridW.flatten()if verbose:print('Image: w {}, h {}, gs {}, ps {}, nFea {}'.\format(W,H,gS,pS,gridH.size))feaArr = self.calculate_sift_grid(image,gridH,gridW)feaArr = self.normalize_sift(feaArr)if positionNormalize:positions = np.vstack((gridH / np.double(H), gridW / np.double(W)))else:positions = np.vstack((gridH, gridW))return feaArr, positionsdef calculate_sift_grid(self,image,gridH,gridW):'''This function calculates the unnormalized sift featuresIt is called by process_image().//此函数计算未规范化的sift特性。//它被process_image()调用。'''H,W = image.shapeNpatches = gridH.sizefeaArr = np.zeros((Npatches,Nsamples*Nangles))# calculate gradientGH,GW = gen_dgauss(self.sigma)IH = signal.convolve2d(image,GH,mode='same')IW = signal.convolve2d(image,GW,mode='same')Imag = np.sqrt(IH**2+IW**2)Itheta = np.arctan2(IH,IW)Iorient = np.zeros((Nangles,H,W))for i in range(Nangles):Iorient[i] = Imag * np.maximum(np.cos(Itheta - angles[i])**alpha,0)#pyplot.imshow(Iorient[i])#pyplot.show()for i in range(Npatches):currFeature = np.zeros((Nangles,Nsamples))for j in range(Nangles):currFeature[j] = np.dot(self.weights,\Iorient[j,gridH[i]:gridH[i]+self.pS, gridW[i]:gridW[i]+self.pS].flatten())feaArr[i] = currFeature.flatten()return feaArrdef normalize_sift(self,feaArr):'''This function does sift feature normalizationfollowing David Lowe's definition (normalize length ->thresholding at 0.2 -> renormalize length)'''siftlen = np.sqrt(np.sum(feaArr**2,axis=1))hcontrast = (siftlen >= self.nrml_thres)siftlen[siftlen < self.nrml_thres] = self.nrml_thres# normalize with contrast thresholdingfeaArr /= siftlen.reshape((siftlen.size,1))# suppress large gradientsfeaArr[feaArr>self.sift_thres] = self.sift_thres# renormalize high-contrast onesfeaArr[hcontrast] /= np.sqrt(np.sum(feaArr[hcontrast]**2,axis=1)).\reshape((feaArr[hcontrast].shape[0],1))return feaArrclass SingleSiftExtractor(DsiftExtractor):'''The simple wrapper class that does feature extraction, treatingthe whole image as a local image patch.//一个简单的封装类,它能把整个图像当作一个局部图像补丁'''def __init__(self, patchSize,nrml_thres = 1.0,\sigma_edge = 0.8,\sift_thres = 0.2):# simply call the super class __init__ with a large gridSpaceDsiftExtractor.__init__(self, patchSize, patchSize, nrml_thres, sigma_edge, sift_thres)   def process_image(self, image):return DsiftExtractor.process_image(self, image, False, False)[0]if __name__ == '__main__':# ignore this. I only use this for testing purpose...from scipy import miscextractor = DsiftExtractor(8,16,1)image = misc.imread('C:/Users/qgl/Desktop/articles/test1.png')image = np.mean(np.double(image),axis=2)feaArr,positions = extractor.process_image(image)#pyplot.hist(feaArr.flatten(),bins=100)#pyplot.imshow(feaArr[:256])#pyplot.plot(np.sum(feaArr,axis=0))pyplot.imshow(feaArr[np.random.permutation(feaArr.shape[0])[:256]])# test single sift extractorextractor = SingleSiftExtractor(16)feaArrSingle = extractor.process_image(image[:16,:16])pyplot.figure()pyplot.plot(feaArr[0],'r')pyplot.plot(feaArrSingle,'b')pyplot.show()
代码e.g.
如果你的输入图像像素大小是200 * 200,设定步长参数为8,patch块大小为16 * 16,输入图像转换为24 * 24=576个patch块,每个patch块进行SIFT提取关键点,最后得到576个特征点。这样输入图像就转换为了576 * 128维的矩阵向量。
继续添加一个批量处理函数,处理好数据集,就可以进行后续的分类识别工作了。