- 安装
-
yum install haproxy查看版本号
haproxy -v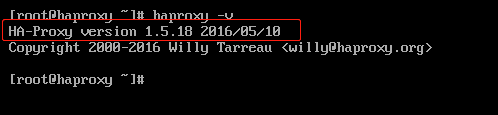
-
修改配置文件为如下内容-->全覆盖后,修改对应端口号即可(文件位置:/etc/haproxy/haproxy.cfg)
-
#---------------------------------------------------------------------
# Global settings
#---------------------------------------------------------------------
globallog 127.0.0.1 local0chroot /var/lib/haproxy              # 改变当前工作目录pidfile /var/run/haproxy.pid         # haproxy的pid存放路径,启动进程的用户必须有权限访问此文件maxconn 4000                         # 最大连接数,默认4000user haproxy                         # 默认用户group haproxy                        # 默认组daemon                               # 创建1个进程进入deamon模式运行。此参数要求将运行模式设置为daemonstats socket /var/lib/haproxy/stats  # 创建监控所用的套接字目录
#---------------------------------------------------------------------
# defaults settings
#---------------------------------------------------------------------
# 注意:因为要使用tcp的负载,屏蔽掉与http相关的默认配置
defaultsmode http                            # 默认的模式mode { tcp|http|health },tcp是4层,http是7层,health只会返回OKlog globaloption dontlognull                   # 启用该项,日志中将不会记录空连接。所谓空连接就是在上游的负载均衡器option redispatch                    # serverId对应的服务器挂掉后,强制定向到其他健康的服务器retries 3                            # 3次连接失败就认为服务不可用,也可以通过后面设置        timeout queue 1mtimeout connect 10s                  # 连接超时时间timeout client 1m                    # 客户端连接超时时间timeout server 1m                    # 服务器端连接超时时间timeout check 10s                    maxconn 3000                         # 最大连接数
#---------------------------------------------------------------------
listen admin_stats                           #开启haproxy监控界面bind *:80                            #绑定80端口mode httpoption httplogstats enable                         #开启统计stats refresh 30sstats uri /haproxy?stats             #监控界面url为:http://ip:80/haproxy/statsstats auth admin:123456stats realm welcome\ Haproxystats admin if TRUE
#---------------------------------------------------------------------
listen rabbitmq_admin                        #代理rabbitmq集群的管理界面bind *:15672                         #绑定15672端口mode httpoption httplogserver rmq-n1 10.200.37.201:15672server rmq-n2 10.200.37.202:15672server rmq-n3 10.200.37.203:15672
#---------------------------------------------------------------------
listen rabbitmq_cluster                      #代理rabbitmq集群bind *:5672                          #绑定5672端口mode tcpoption tcplogbalance roundrobinserver rmq-n1 10.200.37.201:5672 check inter 5000 rise 2 fall 2server rmq-n2 10.200.37.202:5672 check inter 5000 rise 2 fall 2server rmq-n3 10.200.37.203:5672 check inter 5000 rise 2 fall 2
此时,访问http://ip:80/haproxy?stats即可看到监控界面

-
特别注意的是:
很多童鞋到这一步,在浏览器输入http://ip:80/haproxy?stats后,监控界面总是出不来!!!
第一时间就认为是haproxy.cfg文件哪一项配置出错了?(检查了无数遍也没发现问题......),甚至都开始怀疑所安装的haproxy版本是否有问题了!
这个haproxy有毒!
耽误了一个多小时,最后才发现:在haproxy.cfg文件中开启监控界面后,所监听的80端口未加入防火墙白名单!!! -
打开指定端口
-
firewall-cmd --zone=public --add-port=80/tcp --permanent
firewall-cmd --reload
查看防火墙白名单列表,可以看到80端口已打开
firewall-cmd --zone=public --list-ports
-
再次访问http://ip:80/haproxy?stats,监控界面出现,大功告成!
详细解决方案
(三)CentOS7 安装 haproxy (开启默认监控界面......)
热度:43 发布时间:2023-12-21 04:44:20.0
相关解决方案
- 请帮忙看下 haproxy 的有关问题,点击 continue 不能等待足够长的时间就显示结果, 多谢
- 请帮忙看下这个 haproxy 的配置以及有关问题,搞不明白哪里面出错,多谢
- CentOS7 安装redis-5.0.5/注册为系统服务及单机启动多个redis服务
- CentOS7.6安装RabbitMQ教程
- Centos7.2下安装jdk
- centos7,docker版本搭建lnmp环境,部署laravel项目,解决大坑,新手教学
- MAC VMware fusion10 Centos7 网络配置
- CentOS7 扩展磁盘容量(虚拟机及物理机同理)
- CentOS7 最小安装命令详解
- centos7 install anaconda
- 黑猴子的家:Centos7 安装部署 Azkaban 3.84.4
- 黑猴子的家:Centos7 安装部署 Azkaban 2.5.0
- 黑猴子的家:Centos7 安装 Oracle 11g
- 黑猴子的家:Centos7 数据恢复
- 黑猴子的家:Centos7 lrzsz 安装和使用
- 黑猴子的家:Centos7 安装 R 3.6.0
- 黑猴子的家:Centos7 修改网卡名称
- linux服务器部署环境(阿里云 centos7.4 64位+ jdk+tomcat+mysql安装)
- CentOS7 -bash:vim:未找到命令
- VMware CentOS7 忘记密码解决方法
- Centos7 安装FastDFS(亲测可用)
- Centos7 安装Redis + 开机自启
- Centos7 安装RabbitMQ + 采坑
- Centos7 mysql5.7.25离线安装
- 【MySQL】CentOS7 MySQL 的部署和安装
- CentOS7 部署 Nginx 环境,跑起一个网页
- centOS7 一键安装docker脚本
- centOs7.2 lamp搭建
- 关于keepalived+haproxy+mycat架构深入理解
- Kubernetes双向TLS配置-Centos7