ЧАбд
- ? дЫааЛЗОГЃКpython3
- ? зїепЃКKЭЌбЇАЁ
- ? ОЋбЁзЈРИЃКЁЖЩюЖШбЇЯА100Р§ЁЗ
- ? ЭЦМізЈРИЃКЁЖаТЪжШыУХЩюЖШбЇЯАЁЗ
- ? бЁздзЈРИЃКЁЖMatplotlibНЬГЬЁЗ
- ? гХаузЈРИЃКЁЖPythonШыУХ100ЬтЁЗ
ДњТыЪЕЯж
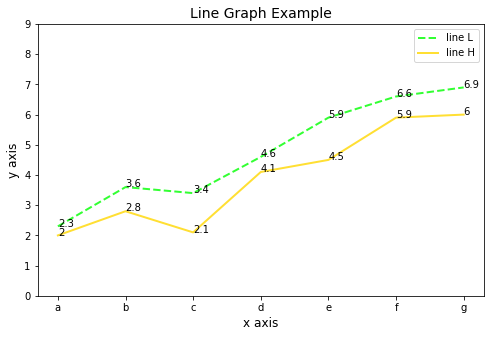
import numpy as np
import matplotlib.pyplot as plty1 = [2.3, 3.6, 3.4, 4.6, 5.9, 6.6, 6.9]
y2 = [2 , 2.8, 2.1, 4.1, 4.5, 5.9, 6]
x = ["a","b","c","d","e","f","g"]
""" ЛцжЦелЯпЭМЗНЗЈplot ВЮЪ§вЛЃКyжс ВЮЪ§ЖўЃКxжс """
plt.figure(figsize=(8,5))
plt.plot(x, y1, label="line L", color='lime', alpha=0.8, linewidth=2, linestyle="--")
plt.plot(x, y2, label="line H", color='gold', alpha=0.8, linewidth=2, linestyle="-")plt.ylim(0,9)plt.xlabel("x axis", fontsize=12)
plt.ylabel("y axis", fontsize=12)
plt.title("Line Graph Example", fontsize=14)for x, y1 in enumerate(y1):plt.text(x, y1, y1)for x, y2 in enumerate(y2):plt.text(x, y2, y2)plt.legend()
plt.show()