在 Go 中内置的几种分析器都是为使用 pprof(https://github.com/google/pprof)的可视化工具而设计的。pprof 本身不是谷歌的官方项目,pprof 一开始设计的目的是分析来自 c++、Java 和 Go 程序的数据。该项目使用 protocol buffer 协议定义了所有 Go 分析器的格式,本文都会对他们进行描述。
Go 项目本身捆绑了(https://github.com/golang/go/tree/master/src/cmd/pprof)一个可以通过 go tool pprof 命令调用的 pprof 工具。除了一些调整外,它与原本的 pprof 工具大致相同。Go 建议始终使用 go tool pprof 命令来进行分析,而不是原来的 pprof 工具来分析 Go 。
特点
pprof 工具提供一个交互式命令行界面,一个 Web UI,还包括各种其他输出格式选项。
文件格式
描述
pprof 相关的格式定义在 profile.proto (https://github.com/google/pprof/blob/master/proto/profile.proto)文件中, 这是一个使用 protocol buffer 协议定义的文件,并且这个文件带有比较全面的注释。另外,还有一个官方的说明(https://github.com/google/pprof/blob/master/proto/README.md) 。pprof 保存在磁盘的文件使用的是 gzip 格式压缩的。
俗话说,一张图胜过千言万语,下面是 pprof 工具的可视化格式,这张图片是使用protodot(https://github.com/seamia/protodot) 工具自动生成的。
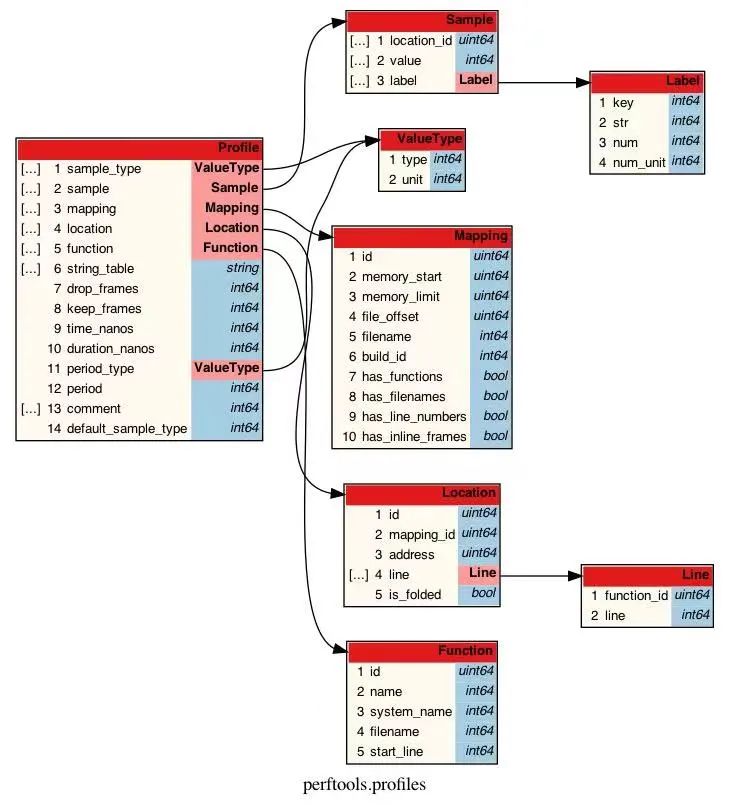
pprof 的数据格式似乎是为效率、多语言 (编程语言) 和不同的性能分析类型 (CPU、堆等) 而设计的,但正因为如此,它非常抽象,显得不直观。如果你想了解所有细节,请点击这里(https://github.com/google/pprof/blob/master/proto/profile.proto) 。继续向下阅读也能知道这么设计的原因。pprof 文件包含采集的堆栈列表,这些堆栈信息具有一个或多个与之关联的数值。比如对于 CPU 性能分析,该值可能是在性能分析期间观察到堆栈的 CPU 持续时间(以纳秒为单位)。对于堆性能分析,它可能是分配的字节数。值类型本身在文件的开头进行了描述,并用于填充 pprof UI 中的 “SAMPLE” 下拉列表。除了值之外,每个堆栈跟踪还可以包括一组标签。标签是键值对,甚至可以包含一个单元。在 Go 中,这些标签应用在分析器标签(https://rakyll.org/profiler-labels/) 上 。
性能分析还包括记录性能分析的时间(UTC 格式)以及记录的持续时间。
另外,这个格式允许删除/保留正则表达式以排除/包括某些堆栈跟踪信息,但 Go 不使用(https://github.com/golang/go/blob/go1.15.6/src/runtime/pprof/proto.go#L375-L376) 它们。还有一个注释列表(也没有使用(https://github.com/golang/go/search?q=tagProfile_Comment)),以及描述采样的周期间隔时间。
在 Go 中生成 pprof 输出的代码可以在:runtime/pprof/proto.go(https://github.com/brendangregg/FlameGraph#2-fold-stacks) 中找到。
解码
下面是一些用于将 pprof 文件解码为人类可读文本输出的工具。它们按输出格式的复杂程度排序,显示简化输出的工具列在最前面:
使用 pprofutils 来进行辅助分析
pprofutils(https://github.com/felixge/pprofutils) 是一个用于在 pprof 文件和 Brendan Gregg 的折叠文本(https://github.com/felixge/pprofutils) 格式之间转换的小工具。你可以这样使用它
$ pprof2text < examples/cpu/pprof.samples.cpu.001.pb.gzgolang.org/x/sync/errgroup.(*Group).Go.func1;main.run.func2;main.computeSum 19
golang.org/x/sync/errgroup.(*Group).Go.func1;main.run.func2;main.computeSum;runtime.asyncPreempt 5
runtime.mcall;runtime.gopreempt_m;runtime.goschedImpl;runtime.schedule;runtime.findrunnable;runtime.stopm;runtime.notesleep;runtime.semasleep;runtime.pthread_cond_wait 1
runtime.mcall;runtime.park_m;runtime.schedule;runtime.findrunnable;runtime.checkTimers;runtime.nanotime;runtime.nanotime1 1
runtime.mcall;runtime.park_m;runtime.schedule;runtime.findrunnable;runtime.stopm;runtime.notesleep;runtime.semasleep;runtime.pthread_cond_wait 2
runtime.mcall;runtime.park_m;runtime.resetForSleep;runtime.resettimer;runtime.modtimer;runtime.wakeNetPoller;runtime.netpollBreak;runtime.write;runtime.write1 7
runtime.mstart;runtime.mstart1;runtime.sysmon;runtime.usleep 3
使用 go tool pprof 命令
pprof 本身有一个名为 -raw 的输出模式,它将向您显示 pprof 文件的内容。但是,应该注意的是,这并不像它得到的那样原始,签出协议如下所示
$ go tool pprof -raw examples/cpu/pprof.samples.cpu.001.pb.gzPeriodType: cpu nanoseconds
Period: 10000000
Time: 2021-01-08 17:10:32.116825 +0100 CET
Duration: 3.13
Samples:
samples/count cpu/nanoseconds19  190000000: 1 2 35   50000000: 4 5 2 31   10000000: 6 7 8 9 10 11 12 13 141   10000000: 15 16 17 11 18 142   20000000: 6 7 8 9 10 11 18 147   70000000: 19 20 21 22 23 24 143   30000000: 25 26 27 28
Locations1: 0x1372f7f M=1 main.computeSum /Users/felix.geisendoerfer/go/src/github.com/felixge/go-profiler-notes/examples/cpu/main.go:39 s=02: 0x13730f2 M=1 main.run.func2 /Users/felix.geisendoerfer/go/src/github.com/felixge/go-profiler-notes/examples/cpu/main.go:31 s=03: 0x1372cf8 M=1 golang.org/x/sync/errgroup.(*Group).Go.func1 /Users/felix.geisendoerfer/go/pkg/mod/golang.org/x/sync@v0.0.0-20201207232520-09787c993a3a/errgroup/errgroup.go:57 s=0...
Mappings
1: 0x0/0x0/0x0   [FN]
上面的样例没有给出全部的内容,点击这里查看所有的内容(https://github.com/gperftools/gperftools/blob/master/src/pprof)。
Using protoc
使用 protoc
对于有兴趣研究更接近原始二进制存储的数据开发者,则需要借助 protocol buffer 的编译器。在 macOS 上,您可以使用 brew install protobuf 来安装它,对于其他平台,请查看protocol buffer 安装部分的内容(https://github.com/gperftools/gperftools/blob/master/src/pprof) 。
现在让我们来分析上面的 CPU 的性能分析数据:
$ gzcat examples/cpu/pprof.samples.cpu.001.pb.gz | protoc --decode perftools.profiles.Profile ./profile.protosample_type {type: 1unit: 2
}
sample_type {type: 3unit: 4
}
sample {location_id: 1location_id: 2location_id: 3value: 19value: 190000000
}
sample {location_id: 4location_id: 5location_id: 2location_id: 3value: 5value: 50000000
}
...
mapping {id: 1has_functions: true
}
location {id: 1mapping_id: 1address: 20393855line {function_id: 1line: 39}
}
location {id: 2mapping_id: 1address: 20394226line {function_id: 2line: 31}
}
...
function {id: 1name: 5system_name: 5filename: 6
}
function {id: 2name: 7system_name: 7filename: 6
}
...
string_table: ""
string_table: "samples"
string_table: "count"
string_table: "cpu"
string_table: "nanoseconds"
string_table: "main.computeSum"
string_table: "/Users/felix.geisendoerfer/go/src/github.com/felixge/go-profiler-notes/examples/cpu/main.go"
...
time_nanos: 1610122232116825000
duration_nanos: 3135113726
period_type {type: 3unit: 4
}
period: 10000000
这份输出样例也是没有给出全部的内容,点击这里查看所有的内容。
历史
最初的 pprof 工具(https://github.com/gperftools/gperftools/blob/master/src/pprof) 是谷歌内部使用 perl 开发的脚本。根据版权标题,开发可能要追溯到 1998 年。它于 2005 年作为 gperftools (https://github.com/google/tcmalloc/blob/master/docs/gperftools.md)的一部分首次发布,并于 2010 年 添加 (https://github.com/golang/go/commit/8b5221a57b41a19abcb4e3dde20014af494048c2)到 Go 项目中。
2014 年,Go 项目用 Raul Silvera 的 Go 实现取代了(https://github.com/golang/go/commit/8b5221a57b41a19abcb4e3dde20014af494048c2)基于 perl 的 pprof 工具,目前谷歌已经使用了这个实现的工具。这个实现在 2016 年作为一个独立的项目(https://github.com/google/pprof) 进行重新发布。从那时起,Go 项目一直在提供上游项目的 pprof,并定期对其进行 更新(https://github.com/golang/go/commits/master/src/cmd/vendor/github.com/google/pprof) 。
Go 1.9(2017-08-24) 增加了对 pprof 标签的支持。它还开始在默认情况下将符号信息包含到 pprof 文件中,这允许在不访问二进制文件的情况下查看程序性能。
Todo
更多的篇幅应该专注于
go tool pprof工具本身.解释为什么可以给 pprof 一个路径到概要文件所属的二进制文件。
更加多关于行号和地址的细节信息
讨论 go 的二进制文件有多个版本时的关联映射问题
免责声明
我是 felixge ,在Datadog 从事关于 go 代码性能分析 的工作。你应该去看看。我们也在 招聘 :)。
本页上的信息不保证是正确的。我们欢迎你的反馈。
原文信息
原文地址:https://github.com/DataDog/go-profiler-notes/blob/main/pprof.md
原文作者:felixge
本文永久链接:https://github.com/gocn/translator/blob/master/2021/w39_go_profiler_notes_pprof_tool_format.md
译者:小超人
校对:fivezh、lsj1342
想要了解关于 Go 的更多资讯,还可以通过扫描的方式,进群一起探讨哦~