文章目录
- 前言
- 一、理论部分
-
- 1、HystrixDashboard
- 2、监控方式
- 3、监控面板信息介绍
- 4、Turbine
- 二、实践部分
-
- 1、hystrix-dashboard使用
-
- 1、创建一个hystrix-dashboard模块
- 2、添加相关依赖包
- 3、在application.properties文件中配置
- 4、在启动类上添加注解
- 5、启动服务
- 6、项目搭建异常及解决过程记录
- 2、Hystrix 集群实例监控
-
- 1、创建一个turbine-service模块
- 2、添加相关依赖包
- 3、在配置文件中配置相关信息
- 4、在启动类上添加注解
- 5、启动服务,监控集群
- 总结
前言
Hystrix Dashboard 是Spring Cloud中查看Hystrix实例执行情况的一种仪表盘组件,支持查看单个实例和查看集群实例,本文将对其用法进行学习。
一、理论部分
1、HystrixDashboard
使用:
- 添加依赖包
<dependency><groupId>org.springframework.cloud</groupId><artifactId>spring-cloud-starter-netflix-hystrix-dashboard</artifactId><version>RELEASE</version></dependency>
在启动类上添加@EnableHystrixDashboard注解启动仪表盘功能。
2、监控方式
有三种不同的监控方式
- 单体Hystrix消费者
通过http://hystrix-app:port/hystrix.stream开启,实现对具体某个服务实例的监控
- 默认集群监控
通过 http://turbine-hostname:port/turbine.stream开启,实现对默认集群的监控
- 自定集群监控
http://turbine-hostname:port/turbine.stream?cluster=[clusterName] ,实现对clusterName集群的监控
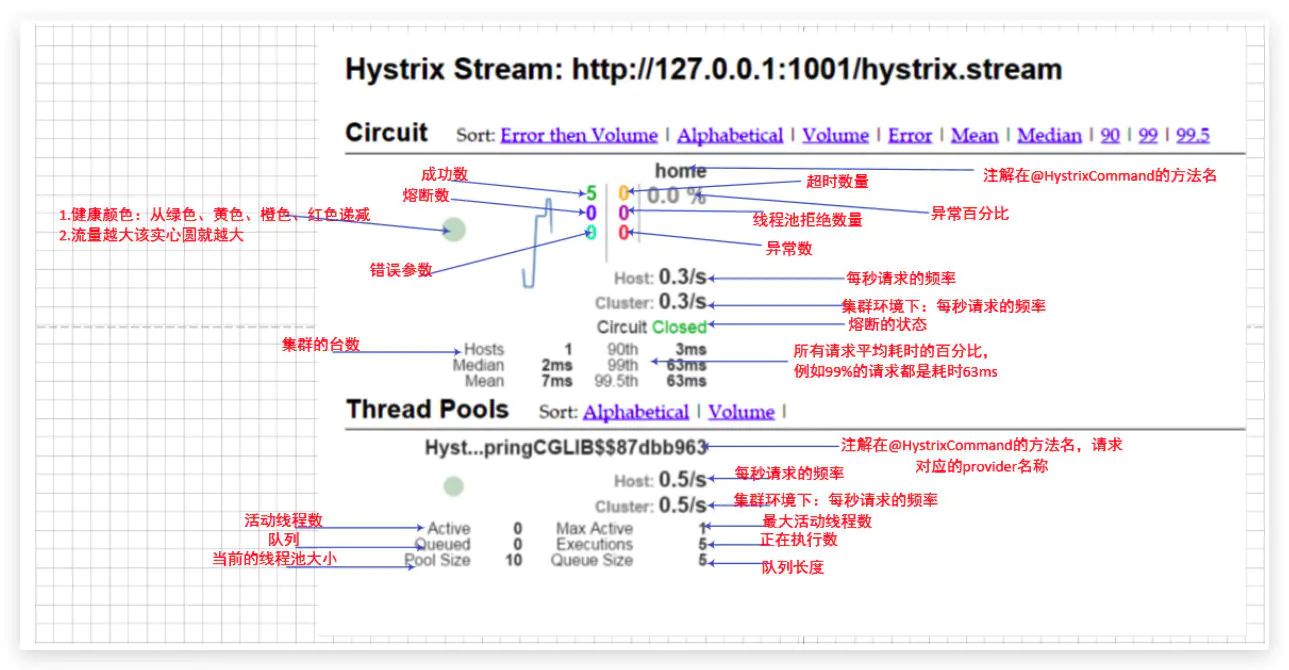
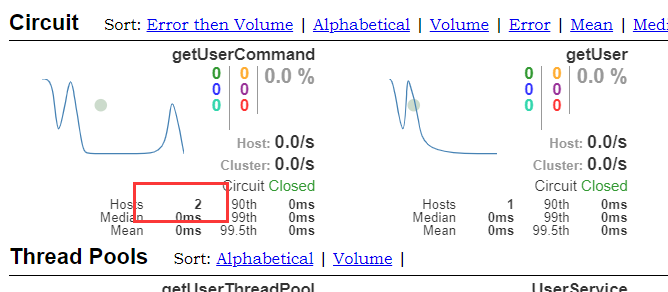
3、监控面板信息介绍
4、Turbine
Turbine 是聚合服务器发送事件流数据的一个工具,hystrix 的监控中,只能监控单个节点,实际生产中都为集群,因此可以通过 turbine 来监控集群服务。
使用:
- 添加依赖包
<dependency><groupId>org.springframework.cloud</groupId><artifactId>spring-cloud-starter-netflix-turbine</artifactId><version>RELEASE</version>
</dependency>
在启动类上添加@EnableTurbine注解,启用Turbine服务。
二、实践部分
1、hystrix-dashboard使用
1、创建一个hystrix-dashboard模块
2、添加相关依赖包
<?xml version="1.0" encoding="UTF-8"?>
<project xmlns="http://maven.apache.org/POM/4.0.0"xmlns:xsi="http://www.w3.org/2001/XMLSchema-instance"xsi:schemaLocation="http://maven.apache.org/POM/4.0.0 http://maven.apache.org/xsd/maven-4.0.0.xsd"><parent><artifactId>eureka</artifactId><groupId>com.hjl</groupId><version>1.0-SNAPSHOT</version></parent><modelVersion>4.0.0</modelVersion><artifactId>hystrix-dashboard-service</artifactId><dependencies><dependency><groupId>org.springframework.cloud</groupId><artifactId>spring-cloud-starter-netflix-eureka-client</artifactId></dependency><dependency><groupId>org.springframework.cloud</groupId><artifactId>spring-cloud-starter-netflix-hystrix</artifactId><version>RELEASE</version></dependency><dependency><groupId>org.springframework.cloud</groupId><artifactId>spring-cloud-starter-netflix-hystrix-dashboard</artifactId><version>RELEASE</version></dependency><dependency><groupId>org.springframework.boot</groupId><artifactId>spring-boot-starter-actuator</artifactId></dependency></dependencies></project>
3、在application.properties文件中配置
server.port=1011spring.application.name=hystrix-dashboard-serviceeureka.client.register-with-eureka=true
eureka.client.fetch-registry=trueeureka.client.service-url.defaultZone=http://root:root@localhost:1001/eureka,http://root:root@localhost:1010/eureka
4、在启动类上添加注解
@EnableHystrixDashboard注解启动hystrix dashboard监控功能
package com.hjl.hystrix_dashboard;import com.netflix.hystrix.contrib.metrics.eventstream.HystrixMetricsStreamServlet;
import org.springframework.boot.SpringApplication;
import org.springframework.boot.autoconfigure.SpringBootApplication;
import org.springframework.boot.web.servlet.ServletRegistrationBean;
import org.springframework.cloud.client.discovery.EnableDiscoveryClient;
import org.springframework.cloud.netflix.hystrix.dashboard.EnableHystrixDashboard;
import org.springframework.context.annotation.Bean;/*** TODO:** @Version 1.0* @Author HJL* @Date 2022/1/1 19:44*/
@EnableHystrixDashboard
@EnableDiscoveryClient
@SpringBootApplication
public class HystrixDashboardApplication {
    public static void main(String[] args) {
    SpringApplication.run(HystrixDashboardApplication.class, args);}@Beanpublic ServletRegistrationBean hystrixMetricsStreamServlet() {
    ServletRegistrationBean registrationBean = new ServletRegistrationBean(new HystrixMetricsStreamServlet());registrationBean.addUrlMappings("/actuator/hystrix.stream");//访问该页面就是监控页面return registrationBean;}}
5、启动服务
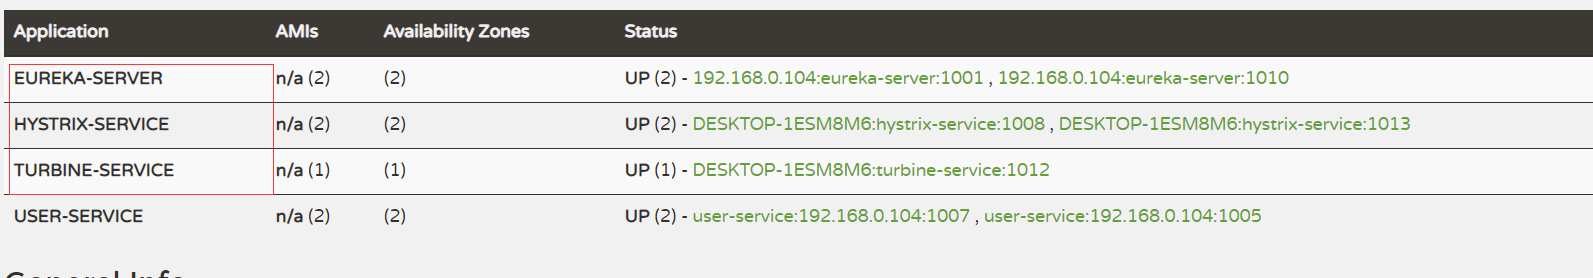
在服务注册中心查看
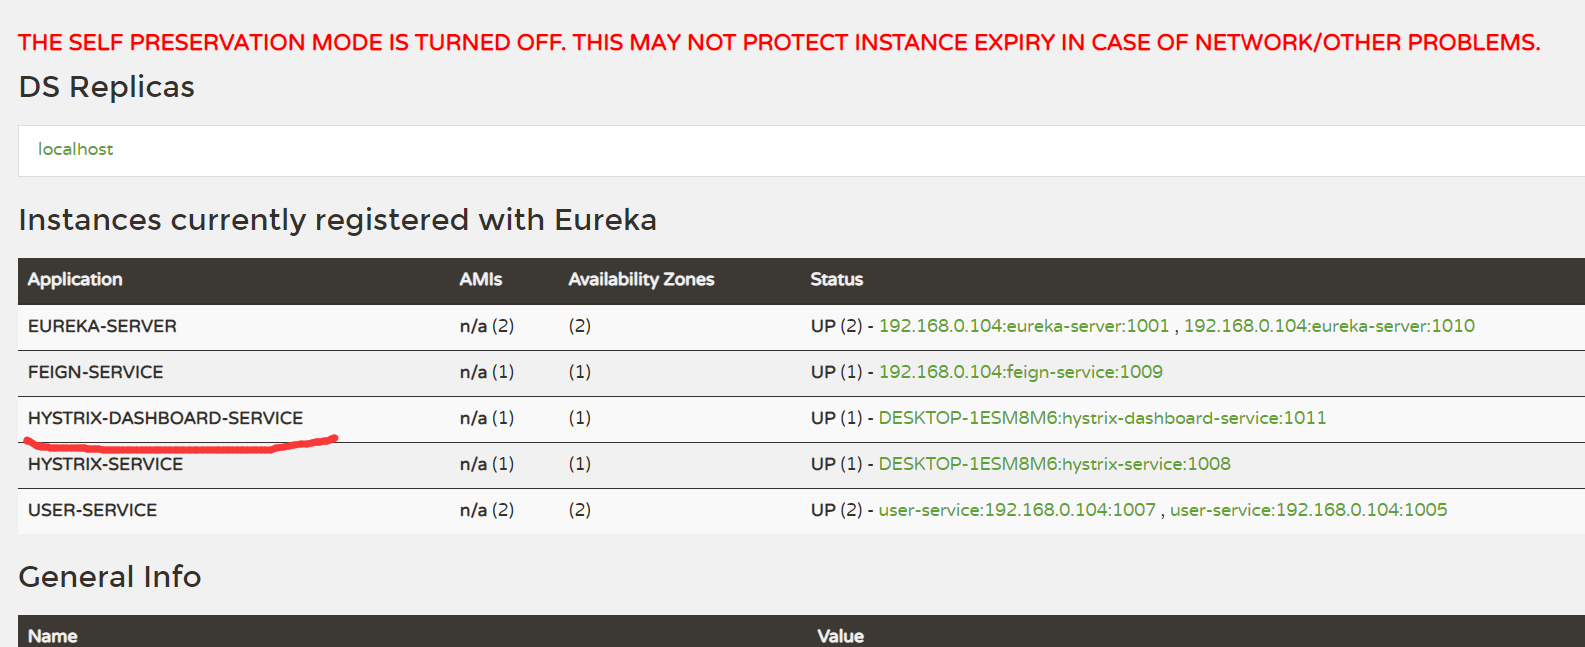
表明服务已经成功注册。
开始访问端口:http://localhost:1011/hystrix:
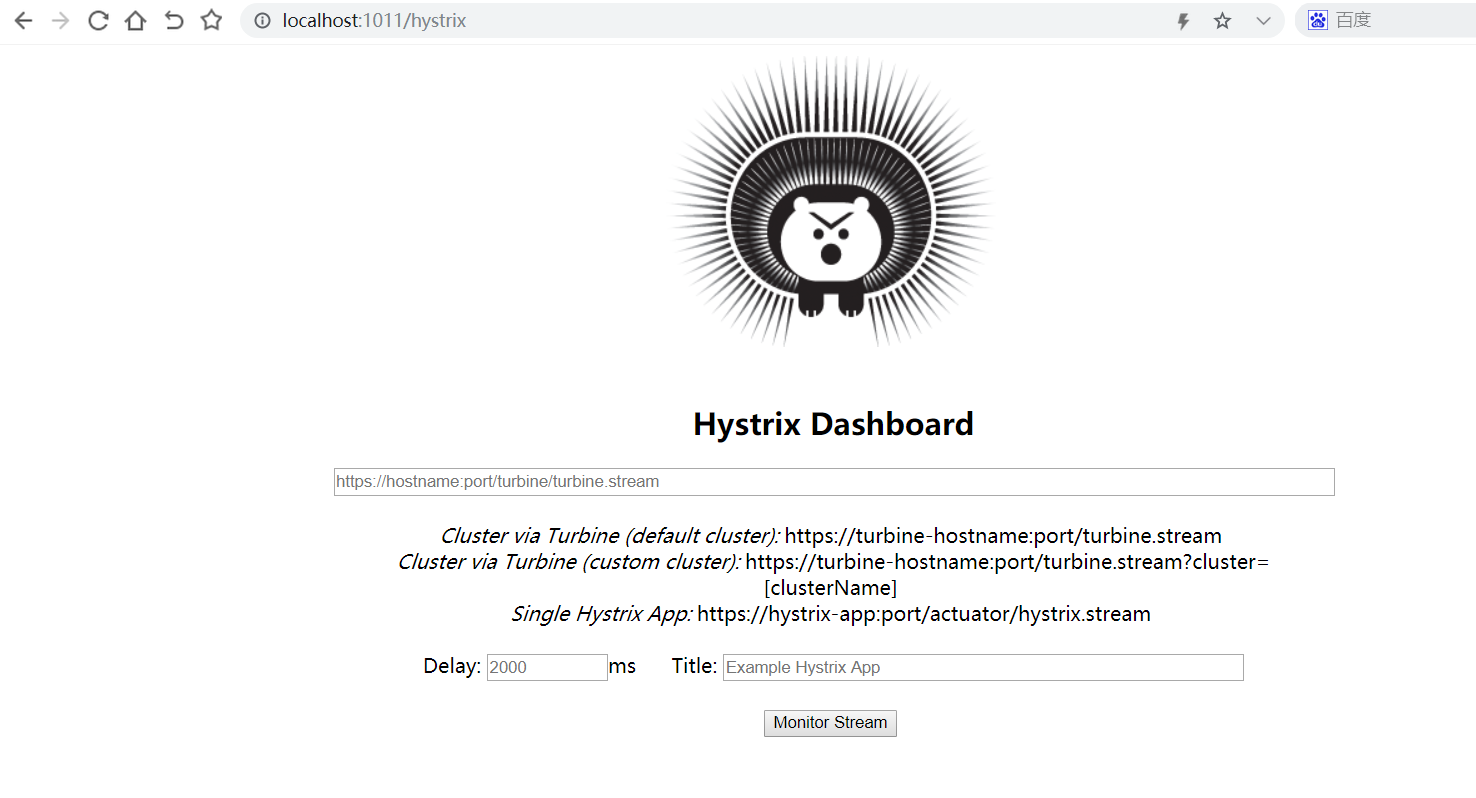
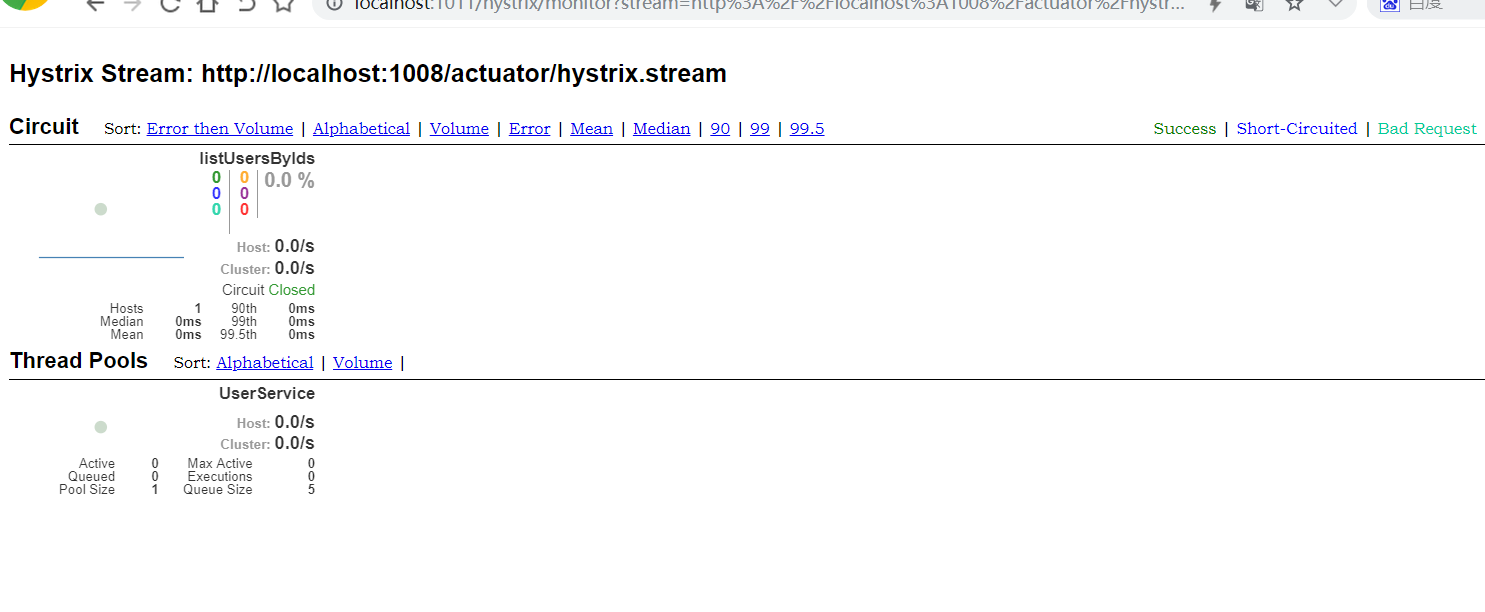
按照提示填写监控的服务地址:http://localhost:1008/actuator/hystrix.stream,然后点击Monitor Streams按钮,进入监控页面:
注:
被监控的hystrix-service服务需要开启Actuator的hystrix.stream端点,配置信息如下:
#暴露hystrix监控端点
management.endpoints.web.exposure.include=hystrix.stream
6、项目搭建异常及解决过程记录
- hystrix-dashboard依赖包的版本不匹配会导致访问dashboard页面时报404错误。
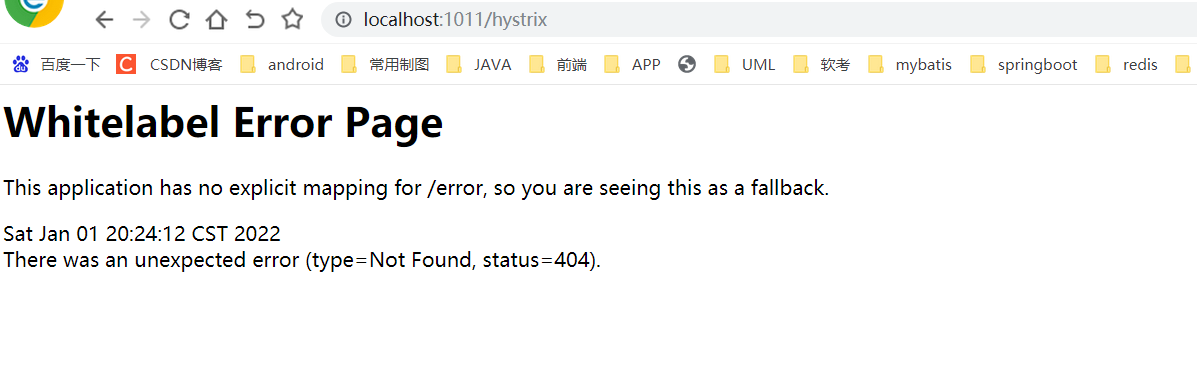
如:
<dependency><groupId>org.springframework.cloud</groupId><artifactId>spring-cloud-starter-netflix-hystrix-dashboard</artifactId><version>2.1.2.RELEASE</version>
</dependency>
修改为:
<dependency><groupId>org.springframework.cloud</groupId><artifactId>spring-cloud-starter-netflix-hystrix-dashboard</artifactId><version>RELEASE</version>
</dependency>
避免版本错误。
- 启用 Hystrix 仪表盘功能出现Unable to connect to Command Metric Stream.的异常。
控制台信息:
http://localhost:1008/actuator/hystrix.stream is not in the allowed list of proxy host names. If it should be allowed add it to
hystrix.dashboard.proxyStreamAllowList.
解决方法:
在配置文件中添加配置:
hystrix.dashboard.proxy-stream-allow-list=localhost
将需要监控的服务的地址填写仅dashboard代理许可列表中。
2、Hystrix 集群实例监控
1、创建一个turbine-service模块
2、添加相关依赖包
<?xml version="1.0" encoding="UTF-8"?>
<project xmlns="http://maven.apache.org/POM/4.0.0"xmlns:xsi="http://www.w3.org/2001/XMLSchema-instance"xsi:schemaLocation="http://maven.apache.org/POM/4.0.0 http://maven.apache.org/xsd/maven-4.0.0.xsd"><parent><artifactId>eureka</artifactId><groupId>com.hjl</groupId><version>1.0-SNAPSHOT</version></parent><modelVersion>4.0.0</modelVersion><artifactId>turbine-service</artifactId><dependencies><dependency><groupId>org.springframework.boot</groupId><artifactId>spring-boot-starter-actuator</artifactId></dependency><dependency><groupId>org.springframework.cloud</groupId><artifactId>spring-cloud-starter-netflix-eureka-client</artifactId></dependency><dependency><groupId>org.springframework.cloud</groupId><artifactId>spring-cloud-starter-netflix-turbine</artifactId><version>RELEASE</version></dependency></dependencies>
</project>
3、在配置文件中配置相关信息
server.port=1012spring.application.name=turbine-serviceeureka.client.register-with-eureka=true
eureka.client.fetch-registry=trueeureka.client.service-url.defaultZone=http://root:root@localhost:1001/eureka,http://root:root@localhost:1010/eureka# 指定需要收集信息的服务名称
turbine.app-config=hystrix-service
# 指定服务所属集群
turbine.cluster-name-expression=new String('default')
# 以主机名和端口号区分服务
turbine.combine-host-port=true
4、在启动类上添加注解
通过@EnableTurbine注解启动Turbine的集群监控功能。
package com.hjl.turbine;import org.springframework.boot.SpringApplication;
import org.springframework.boot.autoconfigure.SpringBootApplication;
import org.springframework.cloud.client.discovery.EnableDiscoveryClient;
import org.springframework.cloud.netflix.turbine.EnableTurbine;/*** TODO:** @Version 1.0* @Author HJL* @Date 2022/1/1 21:18*/
@EnableTurbine
@EnableDiscoveryClient
@SpringBootApplication
public class TurbineServiceApplication {
    public static void main(String[] args) {
    SpringApplication.run(TurbineServiceApplication.class, args);}}
5、启动服务,监控集群
对测试监控的的hystrix-service服务集群,再启动一个端口服务。
此时服务注册中心的服务列表如下:
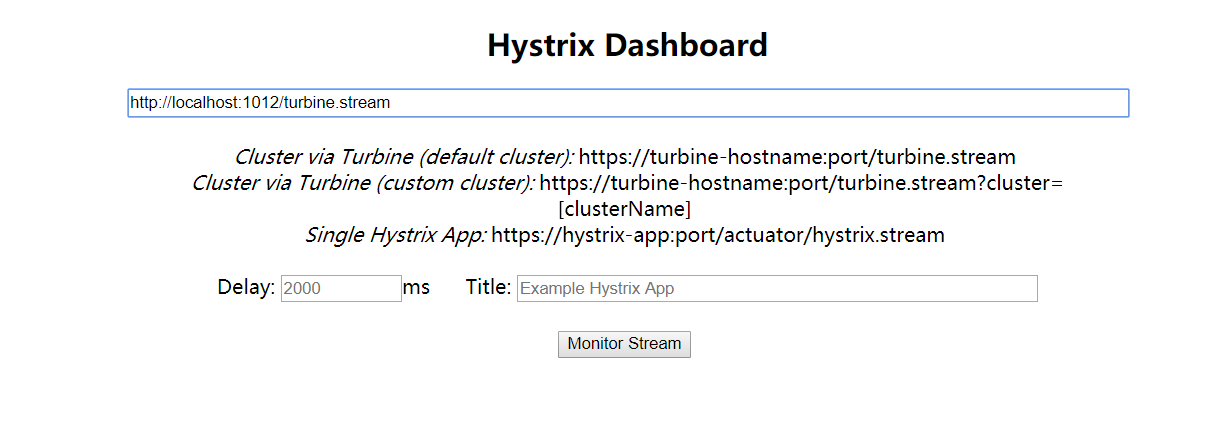
访问Hystrix Dashboard:http://localhost:1011/hystrix,填写集群监控的地址:
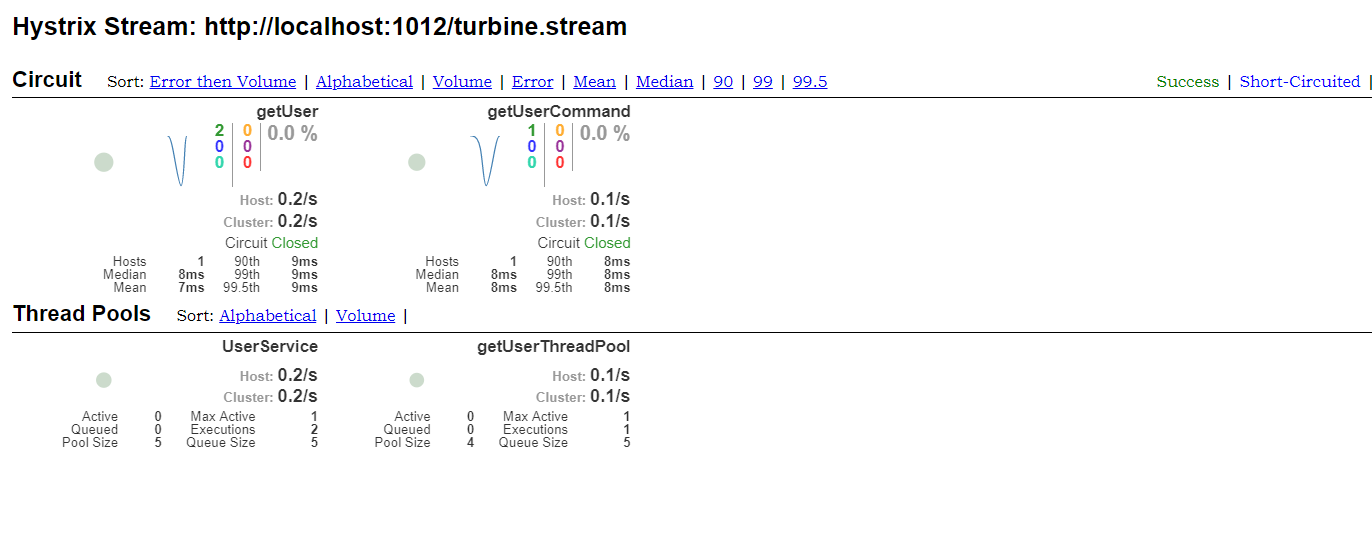
总结
Hystrix提供了Hystrix Dashboard来实时监控HystrixCommand方法的执行情况。 Hystrix Dashboard可以有效地反映出每个Hystrix实例的运行情况,帮助我们快速发现系统中的问题,从而采取对应措施。