Excel 2013在BI终端的分析与展示方面增加了不少功能,PowerView就是其中之一。利用PowerView工具,普通的Excel菜鸟也可以轻松打造专业化的数据仪表盘,而且还可以是动态更新的、灵活透视的。下面就简单介绍一下从数据导入到PowerView制作仪表盘的大概过程:
①导入数据:点击Excel“数据”菜单下,“获取外部数据”――“现有链接”(此处假设导入的是呼叫中心系统导出的Excel文件,不同的文件类型有不同的导入方式)。
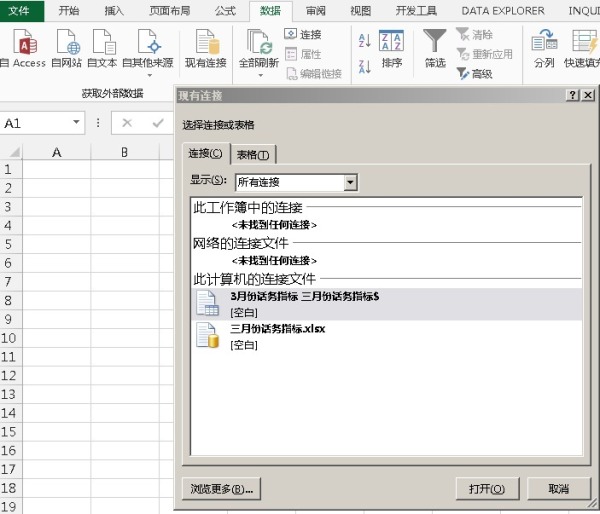
②在弹出的对话框中选择左下角“浏览更多”。
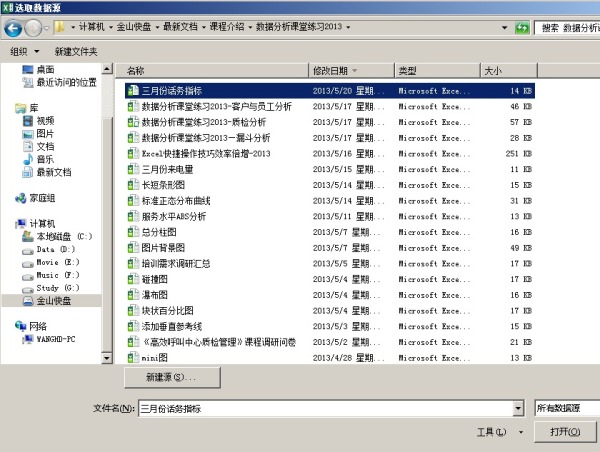
③找到要导入的数据文件“三月份话务指标”,点击右下角“打开”,会看到如下的工作表选择对话框。
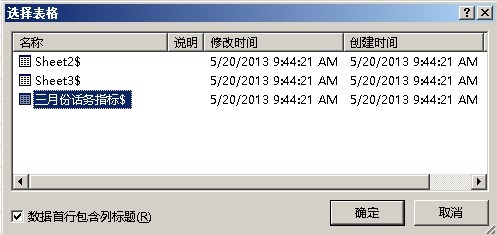
④ 选择“三月份话务指标”工作表,然后单击确定,在弹出的对话框中,选择在Excel中要导入的位置。

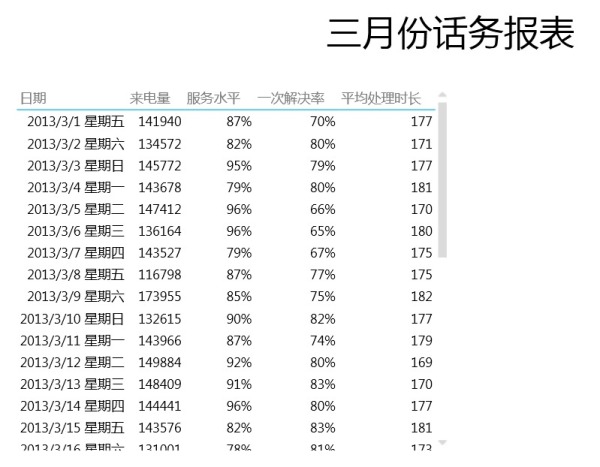
⑤点击确定,工作表内容顺利导入。

⑥鼠标单击工作表上述数据区域任一单元格,在Excel“插入”菜单下,点击“PowerView”(此功能需要Excel 2013 Professional Plus专业增强批量授权版,并在选项中启用PowerView插件),出现如下所示的PowerView面板界面。
⑦ 在右边的字段选择框内,先取消全部勾选,然后勾选“日期”和“来电量”字段,结果如下:

⑧鼠标单击上示数据区域内任意数据,然后在菜单上选择“簇状柱形图”,则报表数字转换为图形。

⑨鼠标拖动四个边角的手柄,调整图表的长度和高度到合适的区间。然后复制图表并拷贝到同一绘图区其它空白的地方,然后选择新的字段和图表样式,最终我们能得到如下所示的精美仪表盘了。

这仅仅是PowerView的最基础功能,其它诸如交互筛选、数据地图、动态演进等功能留待大家去深入研究。
@个人研究,欢迎指正,转载请注明出处。
行业数据 Excel 商业智能 BI powerview
------解决方案--------------------
很漂亮的应用,不知道PowerView是不是支持从Analysis Service中获取数据?
------解决方案--------------------
要Sql Server 2012配合,也看过他们做的。
------解决方案--------------------
曾在excel 2013环境下做了一个power view 的demo,十分漂亮,有map, bubble chart, etc. power view的filter, slicer, sort, hiararchy 等功能比较强大。
如果想自学的一些关键词是 BISM (business intelligence semantic model) DAX (data analysis expression)Power Pivot, Power View, SharePoint.
------解决方案--------------------
excel目前还没有daxmd,powerview在excel里是连不上multidimensional cube的。只有sharepoint mode下才可以,并且服务器端需要安装sql server 2012 sp1 cu4。