文章目录
-
- Interaction -- 地图数据可视化
-
- JSON
- 地图数据的表达 -- TopoJson, GeoJson
-
- TopoJson
- GeoJson
- Json数据的读取
- 编程(内含一些可能会遇见的坑)
-
- geoPath
- 数据绑定
- 比例尺(如何让地图平铺整个svg)
- 事件
- D3之外的库
-
- D3-Tip
- demo4-Map 地图数据可视化.html
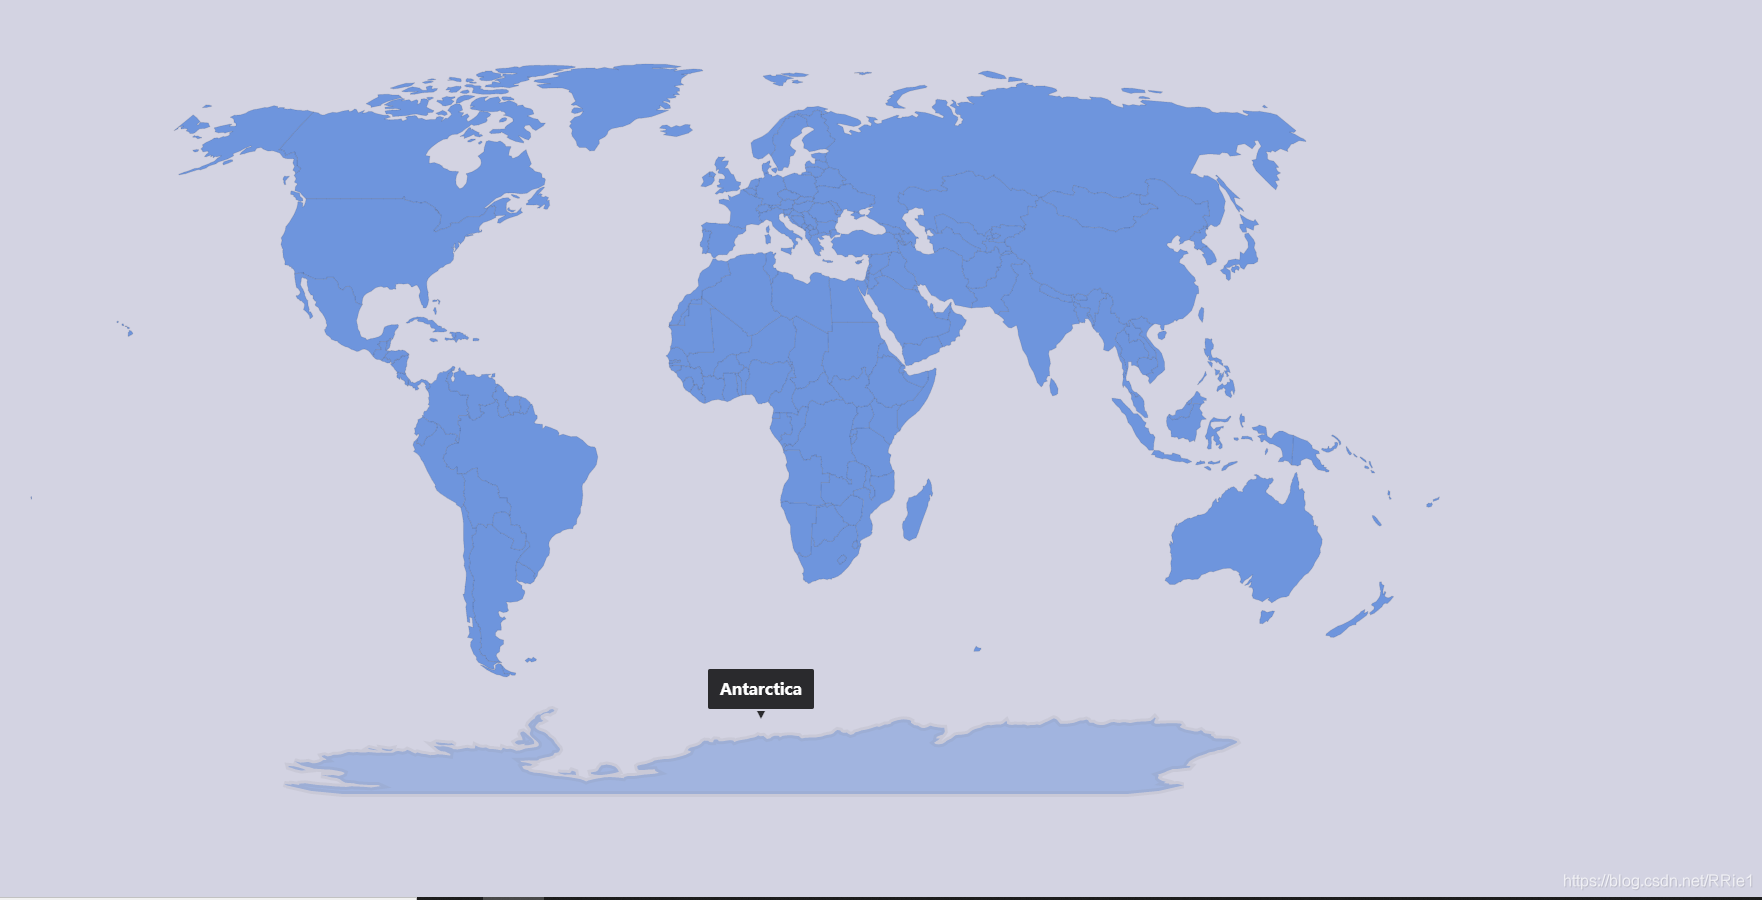
- 可视化效果(鼠标移到某区域上会高亮,点击某区域会显示名字)
Interaction – 地图数据可视化
JSON
JavaScript Object Notation
-
本质上(从数据格式上)是JS的对象
-
保存后是文本
-
文本与JS的对象是可以对等转换的
这点与csv不同,js 读取 csv 的时候会转化成数组
但是js 读取JSON文件时 ,是什么数据就会读出什么数据
地图数据的表达 – TopoJson, GeoJson
TopoJson
- 本质上是Json
- 处理了GeoJson的数据冗余缺点,节约了存储空间
- 由D3的作者 Mike Bostock 制定
TopoJson数据格式:

GeoJson
- 本质上是Json
- D3.js 的geoPath 使用了GeoJson格式的地图数据
TopoJSON与GeoJSON的转换
let geoJson = topojson.feature(data, data.objects.countries);
Json数据的读取
//与读取csv的函数格式类似
d3.json(filepath).then(function)
编程(内含一些可能会遇见的坑)
geoPath
const projection = d3.geoNaturalEarth1() //geoNaturalEarth1是一种常用的映射方式
const geo = d3.geoPath().projection(projection); // project:定义了数据如何投影到地图上
//geo通常用于设计path的d属性
.join('path').attr('d',geo)
数据绑定
需要注意的是,data绑定的不是geoJSON数据,而是features字段
g.selectAll('path').data(geoJSON.features)
比例尺(如何让地图平铺整个svg)
projection调用函数即可
projection.fitSize([innerWidth,innerHeight], geoJson);
事件
设置三要素: 我要为哪些图元 的 哪些事件 设计什么触发动作
d3.select().on('click',function(){
    ...});
新的选择方法:
d3.select().on('click',function(){
    d3.select(this) // this代表了当前触发click事件的“主角”,即返回值为触发了click的事件
});
但是需要注意的是,如果要用this,就不能用 () => {} 箭头函数进行编程了,使用箭头函数不会对this进行映射
Notable:.on() 函数返回的还是图元,因此on() 函数后面还可以调用on
D3之外的库
D3-Tip
这个不作为D3的本体,这是D3社区的一些编程爱好者为了辅助D3使用开发的库
Demo4-map中使用Tip为地图 添加地区名称
demo4-Map 地图数据可视化.html
<!DOCTYPE html>
<html><head><title>Render the Earth</title><!-- <link rel="stylesheet" href="./css/earth.css"> --><script src="./js/d3.min.js"></script><script src="./js/topojson.js"></script><script src="./js/library/d3-tip.js"></script><meta charset="utf-8"><link rel="stylesheet" type="text/css" href="./css/earth.css"><link rel="stylesheet" type="text/css" href="./css/d3tip.css"></head><body><svg width="1600" height="800" id="mainsvg" class="svgs"></svg><script>let svg = d3.select('svg');const width = +svg.attr('width');const height = +svg.attr('height');const margin = {
    top: 60, right: 60, bottom: 10, left: 60};const innerWidth = width - margin.left - margin.right;const innerHeight = height - margin.top - margin.bottom;const g = svg.append('g').attr('id', 'maingroup').attr('transform', `translate(${
      margin.left}, ${
      margin.top})`);const projection = d3.geoNaturalEarth1();const geo = d3.geoPath().projection(projection);// project:数据如何投影到地图上d3.json('./data/countries-110m.json').then(data => {
    //要用d3画地图,必须要将topoJson,转换成geoJsonlet worldmeta = topojson.feature(data, data.objects.countries);console.log(data)console.log(worldmeta);projection.fitSize([innerWidth,innerHeight], worldmeta); const tip = d3.tip().attr('class', 'd3-tip').html(function(d){
    return d.properties.name;});svg.call(tip); //有点类似于 tip(svg) 即把定义好的tip扔给svg//绑定的是g.selectAll('path').data(worldmeta.features).join('path').attr('d', geo).attr('stroke','black').attr('stroke-width', 1).on('mouseover',function(){
    d3.select(this).attr('opacity',0.5 ).attr('stroke', 'white').attr('stroke-width', 6)}).on('mouseout' , function(){
    d3.select(this).attr('opacity',1 ).attr('stroke', 'black').attr('stroke-width', 1)}).on('click' , function(d) {
    tip.show(d).attr('font-color', 'white')});// .html直接设置html标签});</script></body>
</html>
可视化效果(鼠标移到某区域上会高亮,点击某区域会显示名字)
