特征空间映射
1. 问题
- 简单的0,1分类 – 即标签
y= {0,1 } - 特征值:
x=[x1,x2] 二维
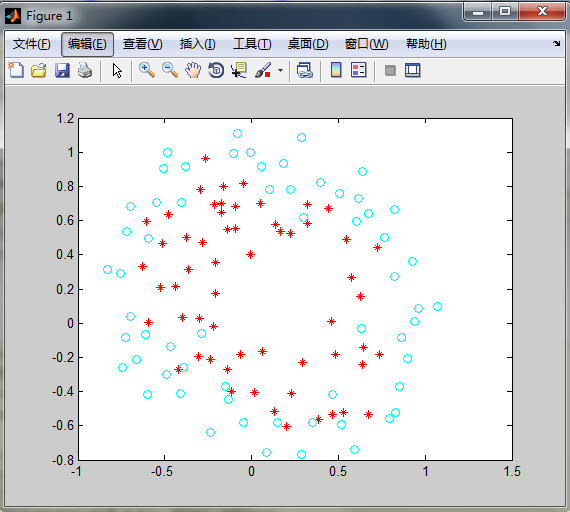
数据离散点如图: 
2.解答
- 数据是二维的,因此如果利用Logistics Regression 的到的
θ 只有三个数,所以分类超平面是二维坐标下的直线 - 由数据分布图可以知道分类超平面应该是一个二次曲线,所以这里利用多项式核函数:
K=(<x1,x2>+R)d ,令R= 1, d = 2.可以得出二维数据映射到五维时,二次曲线成为五维空间中的直线,因此我们将二维数据x=[x1,x2] 扩展到五维x=[x1,x21,x2,x22,x1x2] - 因此超平面表达式如下:
θ1+θ2?x1+θ3?x21+θ4?x2+θ5?x22+θ6?x1x2=0 θ 和J 的计算方式依然不变,这里采用fminunc函数计算最优解
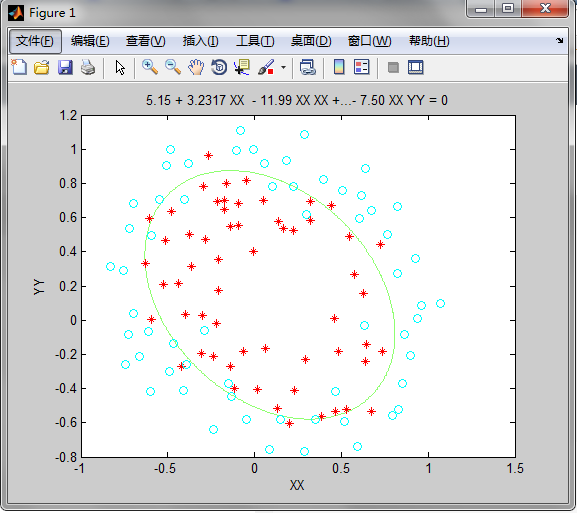
3.效果如下
最后结果:
theta = 5.1555 3.2317 -11.9929 4.1505 -11.7849 -7.4954>> costcost = 0.3481图形如下:

代码
1. Logistics_Regression
%% part0: 准备data = load('ex2data2.txt');x = data(:,[1,2]);y = data(:,3);pos = find(y==1);neg = find(y==0);x1 = x(:,1);x2 = x(:,2);plot(x(pos,1),x(pos,2),'r*',x(neg,1),x(neg,2),'co');m = size(y,1);X = zeros(m,6);X(:,1) = ones(m,1);X(:,2) = x(:,1);X(:,3) = x(:,1).*x(:,1);X(:,4) = x(:,2);X(:,5) = x(:,2).*x(:,2);X(:,6) = x(:,1).*x(:,2);pause;%% part1: GradientDecent and compute cost of J[m,n] = size(X);theta = zeros(6,1);options = optimset('GradObj', 'on', 'MaxIter', 400);% Run fminunc to obtain the optimal theta% This function will return theta and the cost [theta, cost] = ... fminunc(@(t)(computeCost(X,y,t)), theta, options);display(theta);ezplot('5.15 + 3.2317*XX - 11.99*XX*XX + 4.15*YY - 11.78*YY*YY - 7.50*XX*YY',[-1.0,1.5,-0.8,1.2]);hold onplot(x(pos,1),x(pos,2),'r*',x(neg,1),x(neg,2),'co');pause;2.computeCost
function [J,grad] = computeCost(x, y, theta)%% compute cost: Jm = size(x,1);grad = zeros(size(theta));hx = sigmoid(x * theta); J = (1.0/m) * sum(-y .* log(hx) - (1.0 - y) .* log(1.0 - hx)); grad = (1.0/m) .* x' * (hx - y);end3.sigmoid
function g = sigmoid(z)%% SIGMOID Compute sigmoid functoong = zeros(size(z));g = 1.0 ./ (1.0 + exp(-z));end版权声明:本文为博主原创文章,未经博主允许不得转载。