<span style="font-family: Arial, Helvetica, sans-serif; background-color: rgb(255, 255, 255);">今天主要写写怎么用Visual Studio在Excel里面做图(chart),网上有很多人都讨论过这个问题,但我觉得这里还是写一下C# for financial markets里面怎么写的,因为我觉得这个做出来的比较好。</span>
首先看一下chart在excel里面的结构位置:

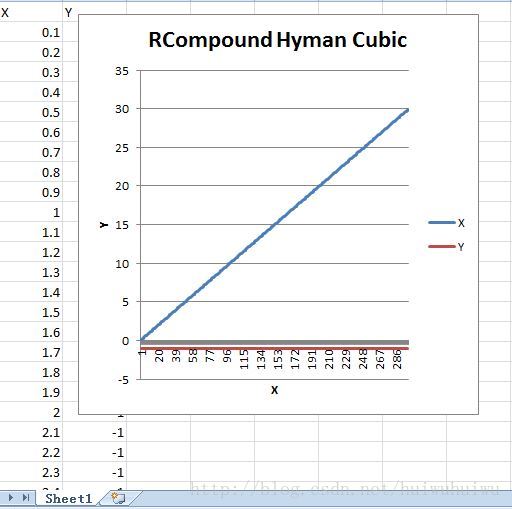
这里作图主要用的就是ChartWizard,但是我刚开始做出来的图巨丑无比。。。而且还不对,不知道为什么,类型已经设置成XY散点图,但是画出来还是这幅尿性。。

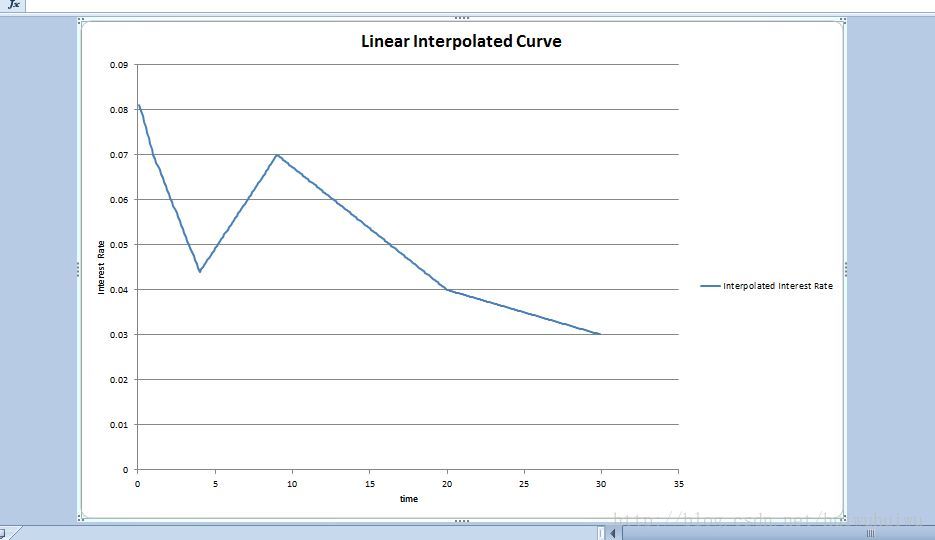
后来经过书中的提示,我实现了这个函数,于是duang地一下,做出来了一张很唯美的chart!!!

// Excel作图 【更新】2015/3/10 public void CreateChart<T>(Vector<T> x, Vector<T> y, string title, string horizontal, string vertical, string legend) { try { // Add sheet. Excel.Workbook pWorkbook; Excel.Worksheet pSheet; if (pExcel.ActiveWorkbook == null) { pWorkbook = (Excel.Workbook)InvokeMethodInternational(pExcel.Workbooks, "Add", Excel.XlWBATemplate.xlWBATWorksheet); pSheet = (Excel.Worksheet)pWorkbook.ActiveSheet; } else { pWorkbook = pExcel.ActiveWorkbook; pSheet = (Excel.Worksheet)InvokeMethodInternational(pWorkbook.Worksheets, "Add", Type.Missing, Type.Missing, 1, Type.Missing); } // Add row labels + values. int sheetColumn = 1; int sheetRow = 1; //打印X列 ToSheetVertical(pSheet, sheetRow, sheetColumn, horizontal, x); //打印Y列 ToSheetVertical(pSheet, sheetRow, sheetColumn + 1, vertical, y); // 在工作簿中增加图表Chart(XY点图) Excel.Chart chart = pWorkbook.Charts.Add(Type.Missing, Type.Missing, Type.Missing, Type.Missing) as Excel.Chart; Excel.Range range = (Excel.Range)pSheet.get_Range("A2","B" + (x.Length+1).ToString() ); chart.ChartWizard(range, Excel.XlChartType.xlXYScatterLinesNoMarkers, 1, Excel.XlRowCol.xlColumns, 1, 0, true, title, horizontal, vertical, Type.Missing); chart.SeriesCollection(1).Name = legend; } catch (Exception e) { Console.WriteLine("Exception: " + e); } } class test { static void Main(string[] args) { Vector<double> t = new Vector<double>(new double[] { 0.1, 1, 4, 9, 20, 30 }, 0); Vector<double> r = new Vector<double>(new double[] { 0.081, 0.07, 0.044, 0.07, 0.04, 0.03 }, 0); LinearInterpolator myInterpolatorH = new LinearInterpolator(t, r); // Create the abscissa values f (hard-coded for the moment) int M = 299; Vector<double> term = new Vector<double>(M, 1); term[term.MinIndex] = 0.1; double step = 0.1; for (int j = term.MinIndex + 1; j <= term.MaxIndex; j++) { term[j] = term[j - 1] + step; } Vector<double> interpolatedlinear = myInterpolatorH.Curve(term); ExcelMechanisms exl = new ExcelMechanisms(); exl.printOneExcel<double>(term, interpolatedlinear, "Linear Interpolated Curve", "time", "Interest Rate", "Interpolated Interest Rate"); Console.Read(); }using System;using System.Collections.Generic;using System.Linq;using System.Text;namespace UserDefinedDataEXP{ //点列 public class Pair <T> { public T first; public T second; public Pair (T First, T Second) { this.first = First; this.second = Second; } } //双线插值 public class BilinearInterpolator { private Vector<double> x1Arr; private Vector<double> x2Arr; private NumericMatrix<double> matVals; private int N1; private int N2; //找出x1Arr中小于或者等于x的index //找出x2Arr中小于或者等于y的index public Pair<int> findAbscissa (double x,double y) { int firstIndex = 0; int secondIndex = 0; for (int i = 0; i <= N1-1; i++) { if (x1Arr[i]<=x && x<=x1Arr[i+1]) { for (int j = 0; j <= N2 - 1; j++) { if (x2Arr[j] <= y && y <= x2Arr[j + 1]) { return new Pair<int>(firstIndex, secondIndex); } secondIndex++; } } firstIndex++; } return null; } //构造器 public BilinearInterpolator(Vector<double> x1arr, Vector<double> x2arr, NumericMatrix<double> gridValues) { this.x1Arr = x1arr; this.x2Arr = x2arr; N1 = x1arr.Length - 1; N2 = x2arr.Length - 1; matVals = gridValues; } //返回(x,y)上的值! public double Solve(double x, double y) { Pair<int> p = findAbscissa(x, y); int i = p.first; int j = p.second; // 4 box points, create variables for readability (see Wiki) double Q11 = matVals[i, j]; double Q22 = matVals[i + 1, j + 1]; double Q12 = matVals[i, j + 1]; double Q21 = matVals[i + 1, j]; double x1 = x1Arr[i]; double x2 = x2Arr[i + 1]; double y1 = x2Arr[j]; double y2 = x2Arr[j + 1]; double factor = 1.0 / ((x2 - x1) * (y2 - y1)); return (Q11 * (x2 - x) * (y2 - y) + Q21 * (x - x1) * (y2 - y) + Q12 * (x2 - x) * (y - y1) + Q22 * (x - x1) * (y - y1)) * factor; } //根据输入的(x,y)点列集,给出插值后的Surface public NumericMatrix<double> Surface(Vector<double> x1arr, Vector<double> x2arr) { NumericMatrix<double> result=new NumericMatrix<double>(x1arr.Length, x1arr.Length); for (int i = x1arr.MinIndex; i <= x1arr.MaxIndex; i++) { for (int j = x2arr.MinIndex; j <= x2arr.MaxIndex; j++) { result[i, j] = Solve(x1arr[i], x2arr[j]); } } return result; } public NumericMatrix<double> Surface() { // Create the interpolated surface, MEMBER DATA AS ABSCISSAE return Surface(x1Arr, x2Arr); } } // LinearInterpolator【更新】2015/3/10 public class LinearInterpolator { public Vector<double> t; public Vector<double> observedRate; public LinearInterpolator(Vector<double> t, Vector<double> ObservedRate) { this.t = t; this.observedRate = ObservedRate; } public Vector<double> Curve(Vector<double> term) { int size = term.Length; Vector<double> result = new Vector<double>(term.Length,term.MinIndex); for (int i =term.MinIndex ; i <=term.MaxIndex; i++) { if (term[i]<=t[t.MinIndex]) { result[i] = observedRate[observedRate.MinIndex]; } else if (term[i]>=t[t.MaxIndex]) { result[i] = observedRate[observedRate.MaxIndex]; } else { for (int j = t.MinIndex; j <=t.MaxIndex-1; j++) { if (term[i] > t[j] && term[i] < t[j + 1]) { result[i] = ((term[i] - t[j + 1]) * observedRate[j] + (t[j] - term[i]) * observedRate[j + 1]) / (t[j] - t[j + 1]); } } } } return result; } }}